Disclaimer
- This tutorial is based on a single-node setup using Debian 12. If you’re using a different distribution or planning a multi-node deployment, some steps and configurations may vary.
Introduction
- The ELK stack is a powerful data analytics and visualization platform consisting of Elasticsearch, Logstash, Kibana and Beats. This integrated suite simplifies the collection, storage, analysis, and visualization of large data sets, enabling users to gain operational insights and monitor system performance. The ELK stack is widely used for log management and analysis, serving a wide range of applications from IT operations to security analytics.
- In this tutorial, I will show you how to install the ELK stack on Debian 12. The
ELK stack consists of the following components:
- Elasticsearch: A distributed, RESTful search and analytics engine designed for horizontal scalability, reliability, and real-time search.
- Logstash: A server-side data processing pipeline that ingests data from multiple sources simultaneously, transforms it, and then sends it to a “stash” like Elasticsearch.
- Kibana: A powerful visualization tool that lets you explore, analyze, and visualize data stored in Elasticsearch.
- Beats: Lightweight data shippers that send data from edge machines to Logstash and Elasticsearch.
Prerequisites
- CPU: 2+ cores
- RAM: 4+ GB
- Disk: 50+ GB
- OS: Debian or Redhat based Linux distributions
Step 1 - Setup Environment
-
The first step is to update the system and install the required packages.
-
For Debian based systems:
sudo apt update && sudo apt install apt-transport-https -
For Redhat based systems:
sudo yum update && sudo yum upgrade -y && sudo yum install -y yum-utils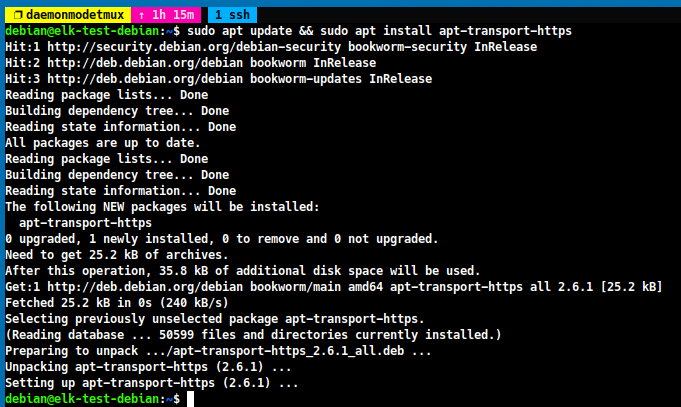
Step 2 - Install ElasticSearch Repository
-
The next step is to add the ElasticSearch repository to the system.
-
For Debian based systems:
wget -qO - https://artifacts.elastic.co/GPG-KEY-elasticsearch | sudo gpg --dearmor -o /usr/share/keyrings/elasticsearch-keyring.gpg echo "deb [signed-by=/usr/share/keyrings/elasticsearch-keyring.gpg] https://artifacts.elastic.co/packages/8.x/apt stable main" | sudo tee /etc/apt/sources.list.d/elastic-8.x.list sudo apt update -
For Redhat based systems:
sudo rpm --import https://artifacts.elastic.co/GPG-KEY-elasticsearch
sudo tee <<EOF /etc/yum.repos.d/elasticsearch.repo >/dev/null
[elasticsearch]
name=Elasticsearch repository for 8.x packages
baseurl=https://artifacts.elastic.co/packages/8.x/yum
gpgcheck=1
gpgkey=https://artifacts.elastic.co/GPG-KEY-elasticsearch
enabled=1
autorefresh=1
type=rpm-md
EOF
Step 3 - Install ElasticSearch
-
Now, we can install ElasticSearch on the system.
-
For Debian based systems:
sudo apt install elasticsearch logstash kibana filebeat default-jre -y -
For Redhat based systems:
sudo yum install elasticsearch logstash kibana filebeat java-21-openjdk -y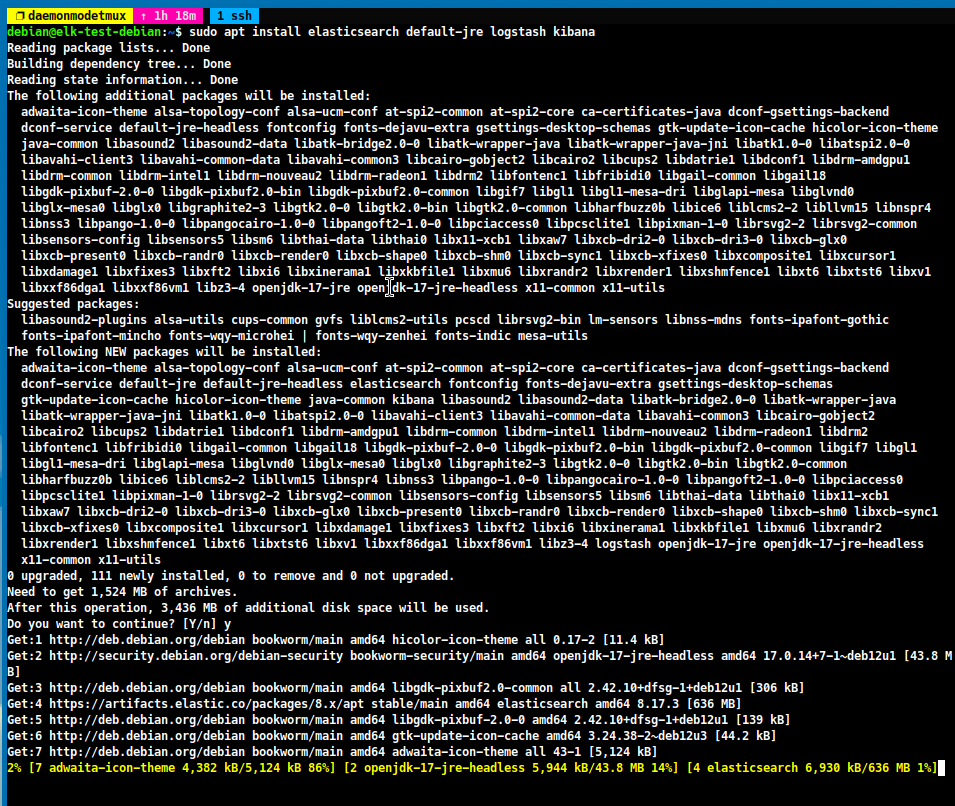
-
When the installation is complete, ElasticSearch generates an initial password for the
elasticuser. You can find this password in the package manager logs and write it down for future use.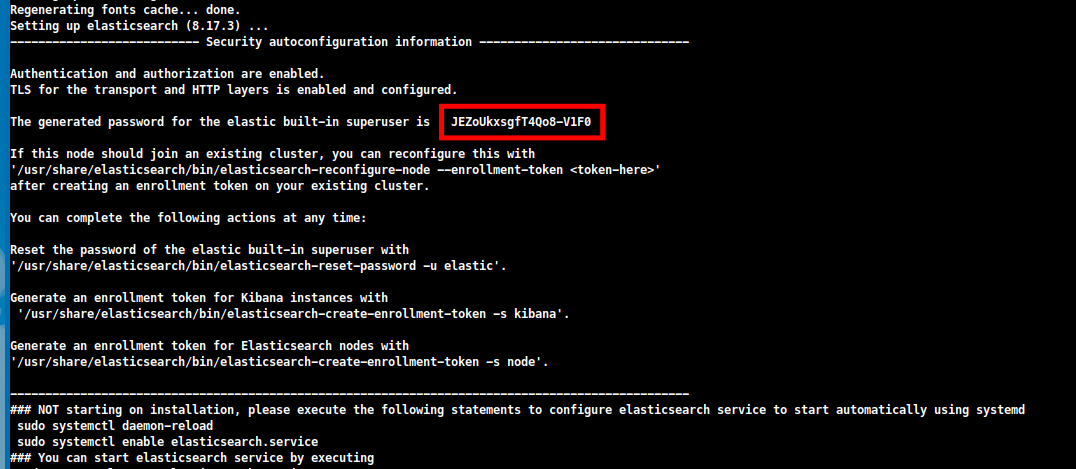
Step 4 - Configure Kibana
-
The next step is to configure Kibana. Open the Kibana configuration file and uncomment the
elasticsearch.hostsline.sudo vim /etc/kibana/kibana.yml
Step 5 - Start Services
-
Now, we can enable and start the ElasticSearch and Kibana services.
sudo systemctl enable --now elasticsearch kibana
Step 6 - Verify ElasticSearch Connection
-
To verify the ElasticSearch connection, you can use the following command.
curl -k https://localhost:9200 --cacert /etc/elasticsearch/certs/http_ca.crt -u elastic | jq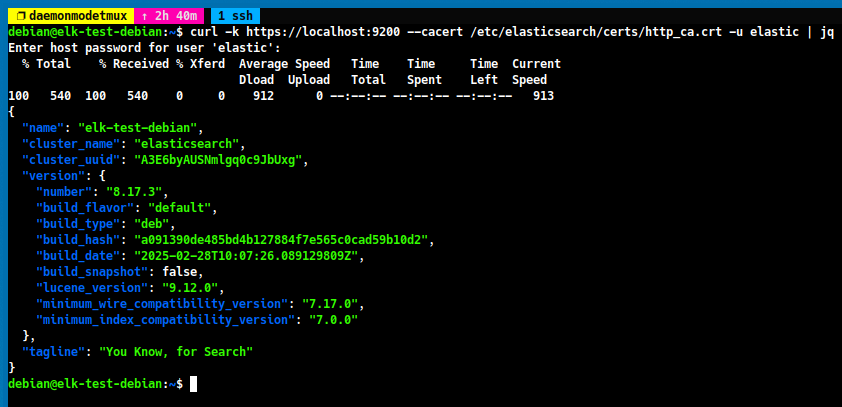
Step 7 - Setup Kibana
-
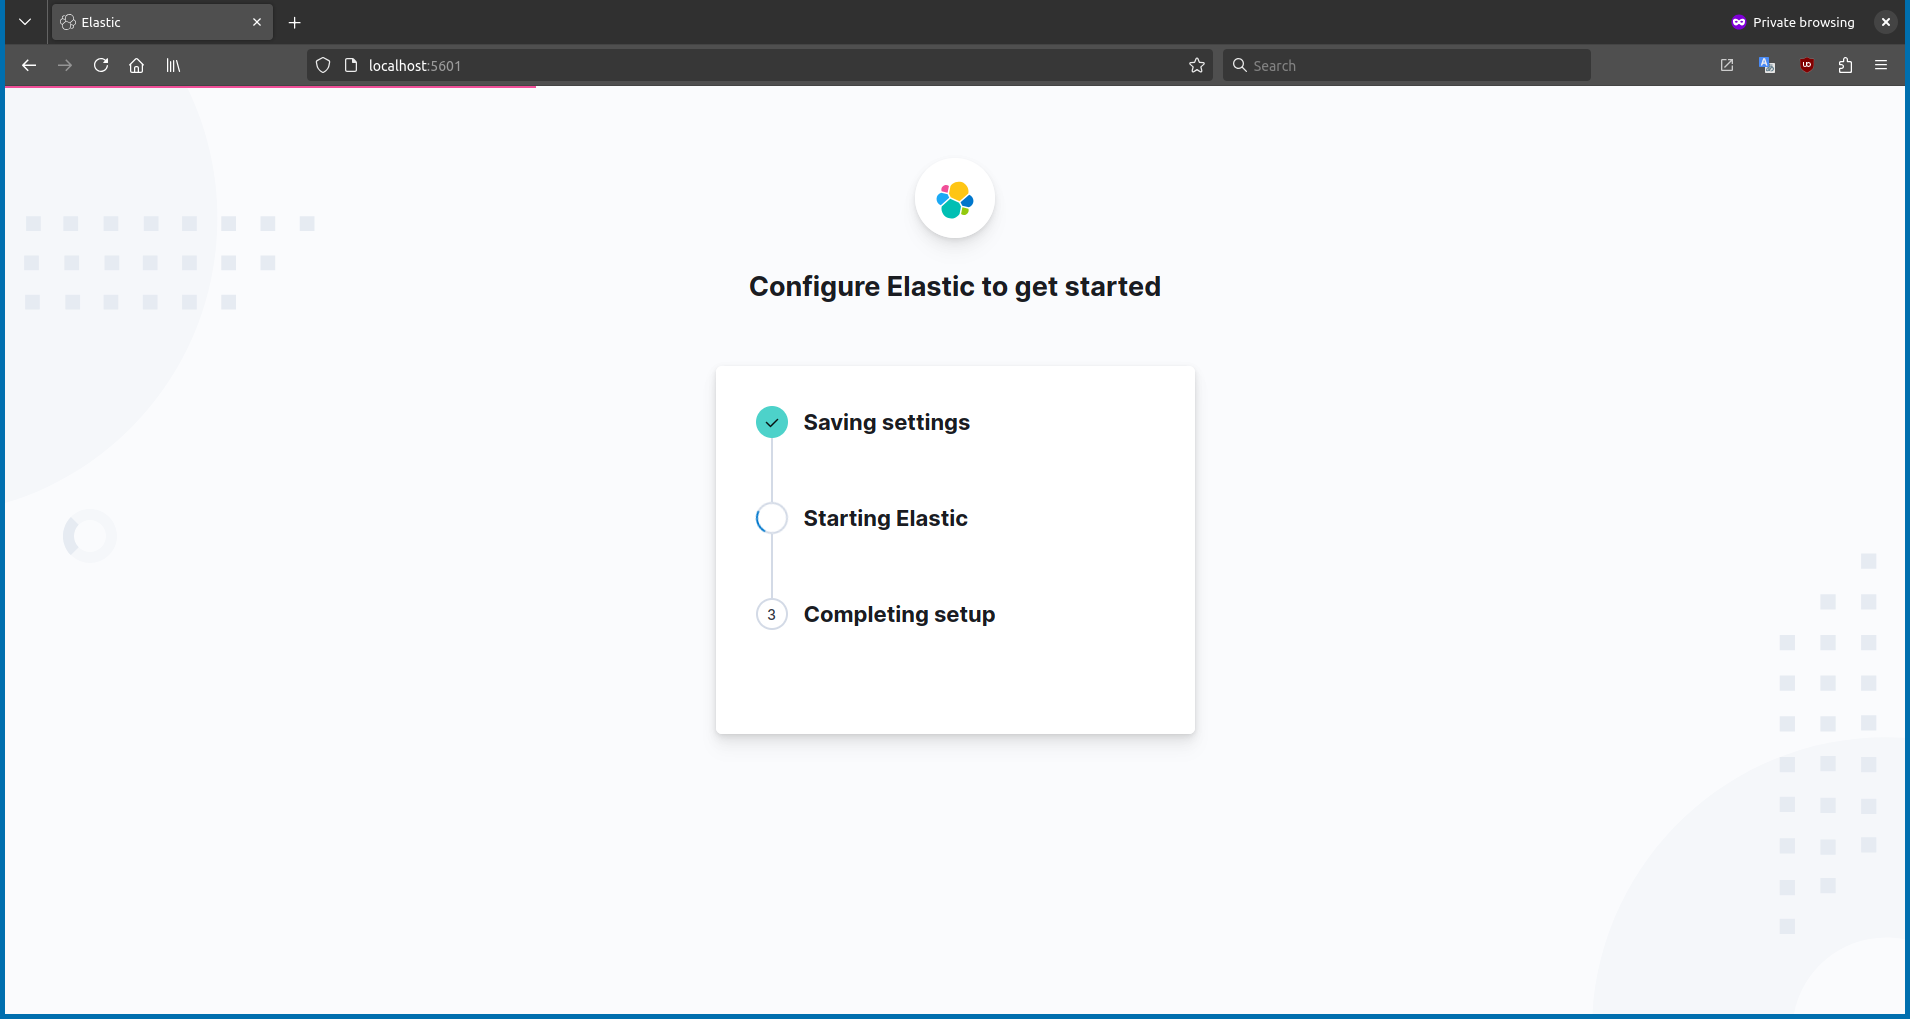
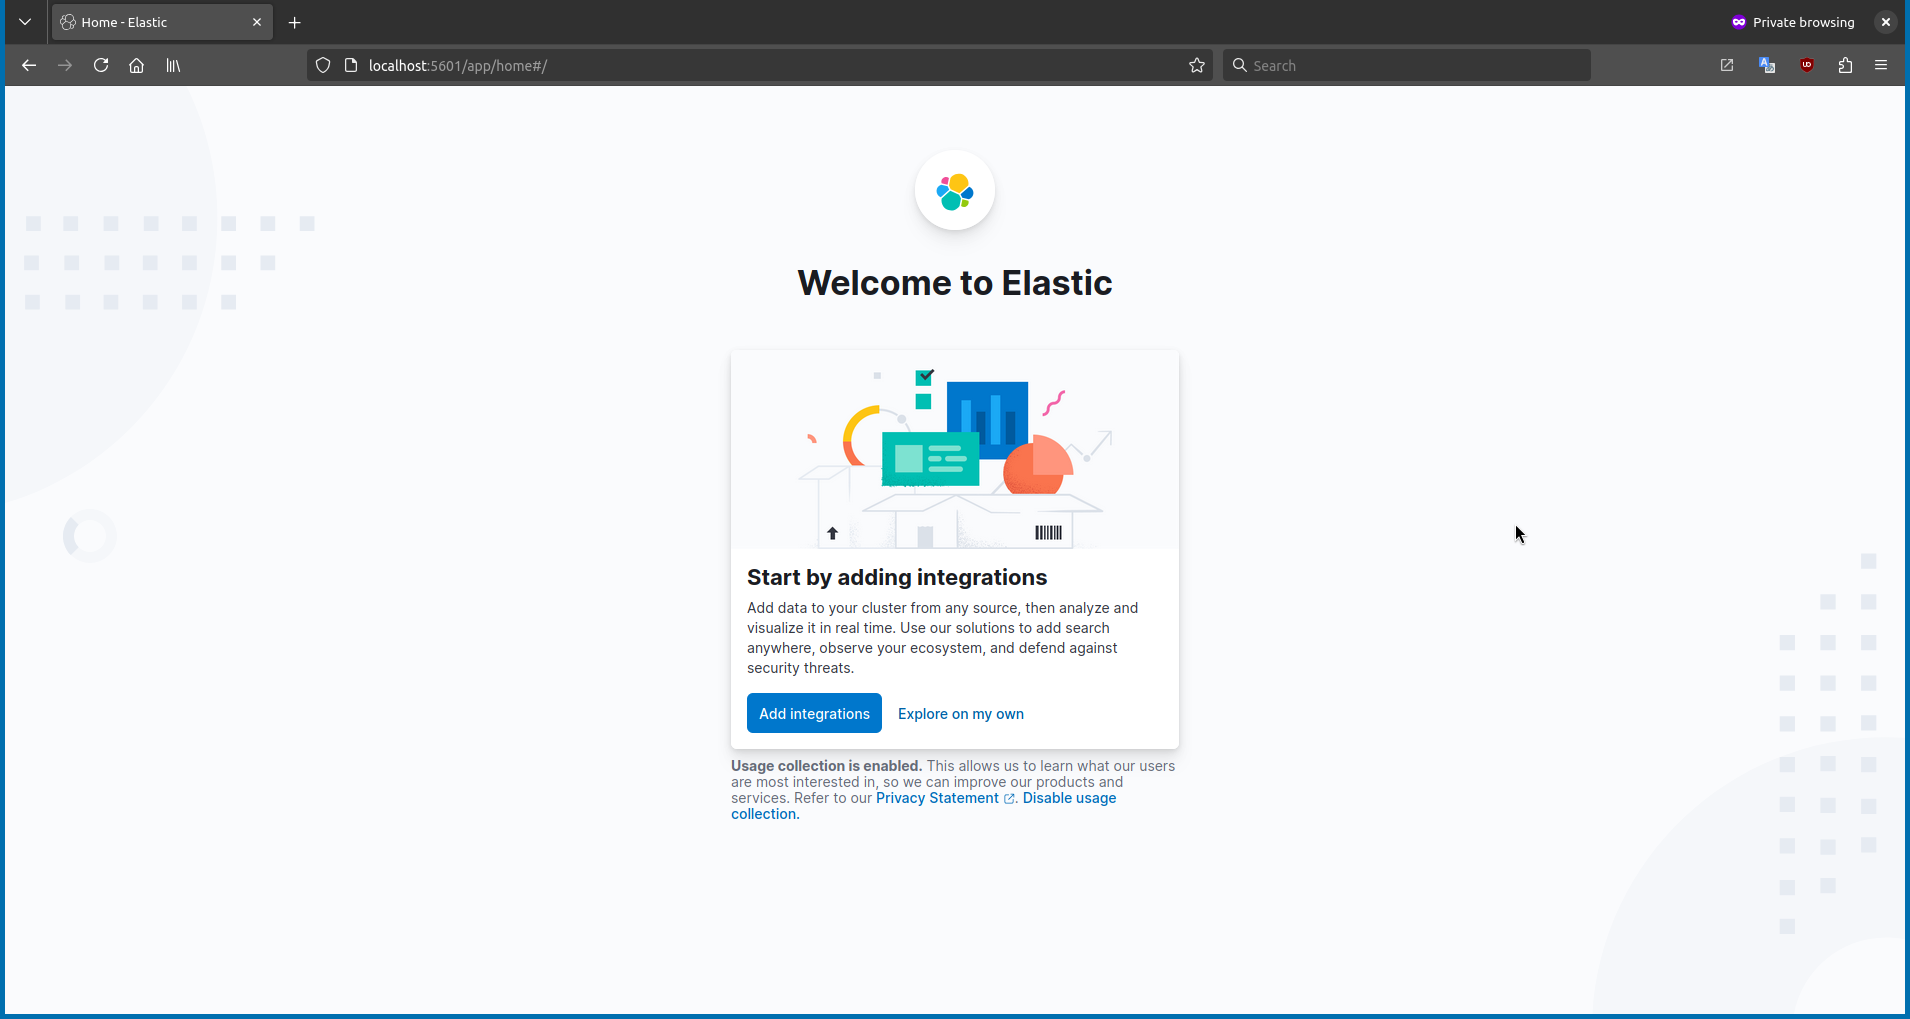
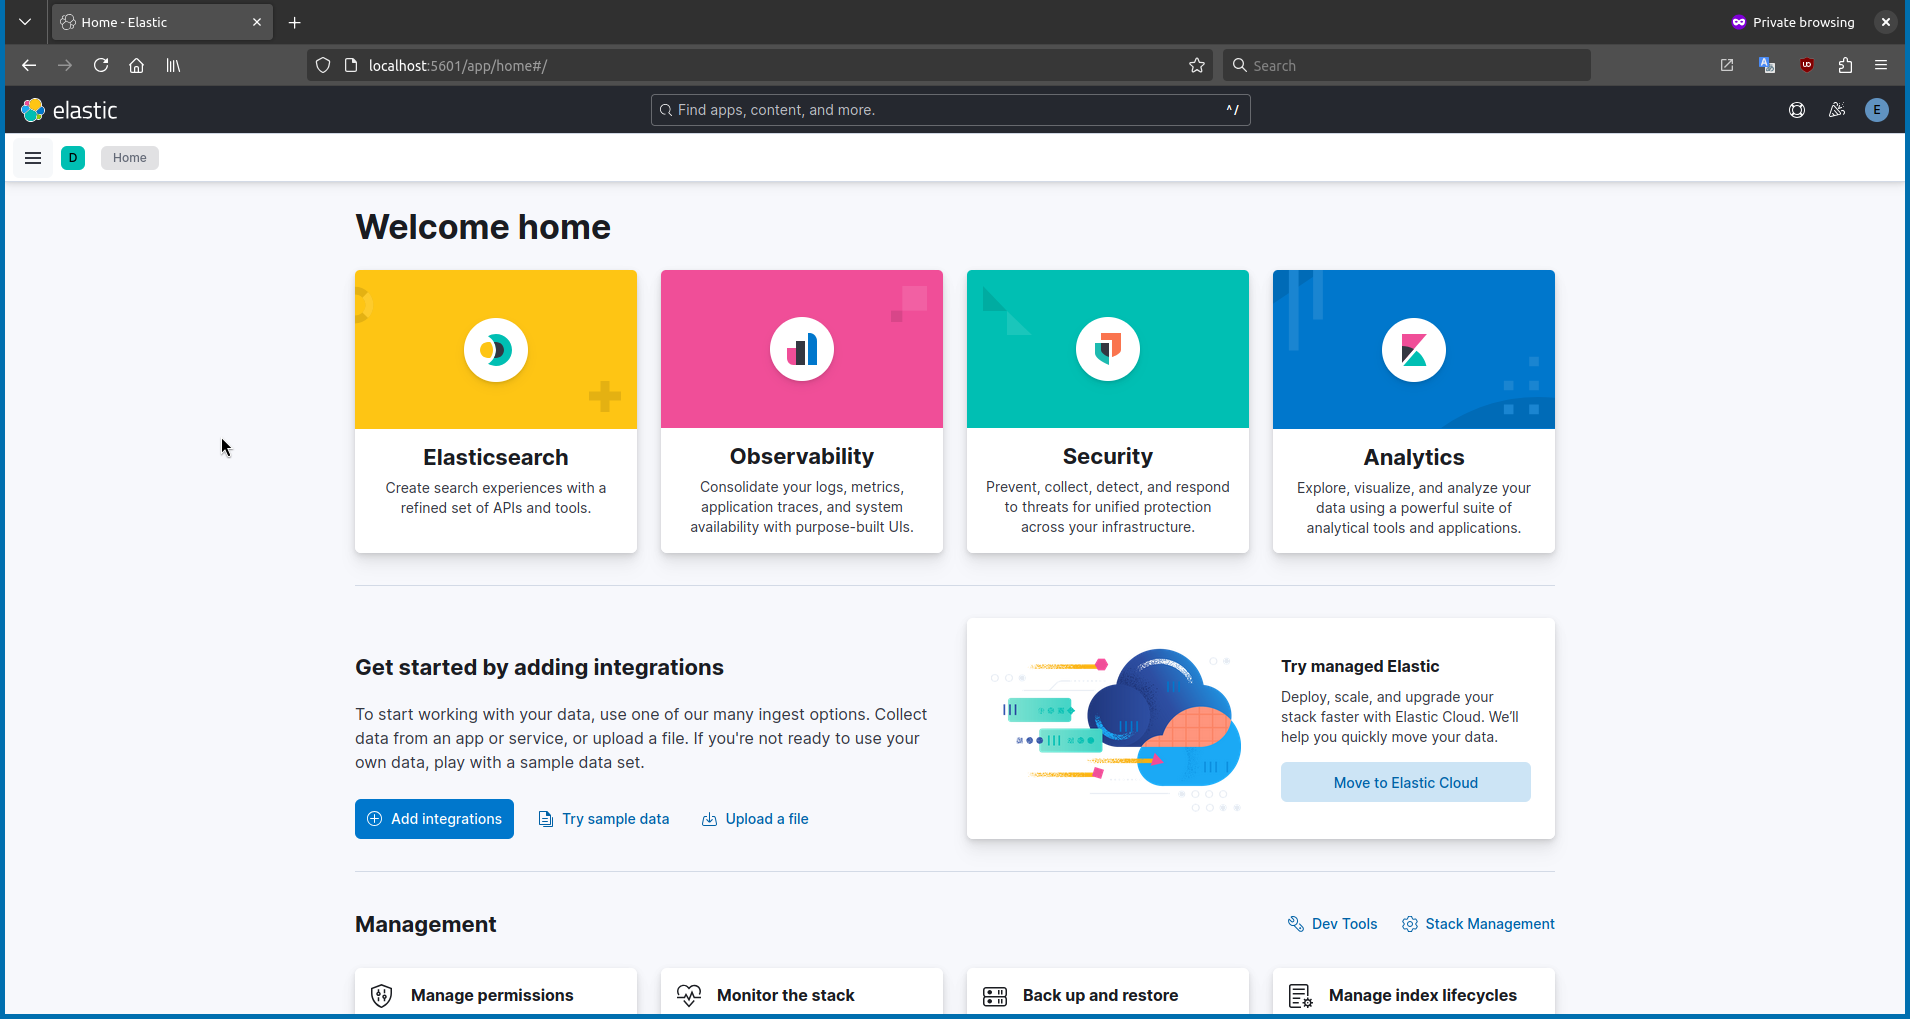
To setup Kibana, open the Kibana interface in your web browser by navigating to
http://localhost:5601. -
Kibana will then ask for an enrollment token. You can generate this token by running the following command:
cd /usr/share/elasticsearch
sudo ./bin/elasticsearch-create-enrollment-token --scope kibana
-
Kibana will then ask for a verification code. You can generate this code by running the following command:
cd /usr/share/kibana
sudo ./bin/kibana-verification-code
Step 8 - Setup Logstash Integration for Kibana
-
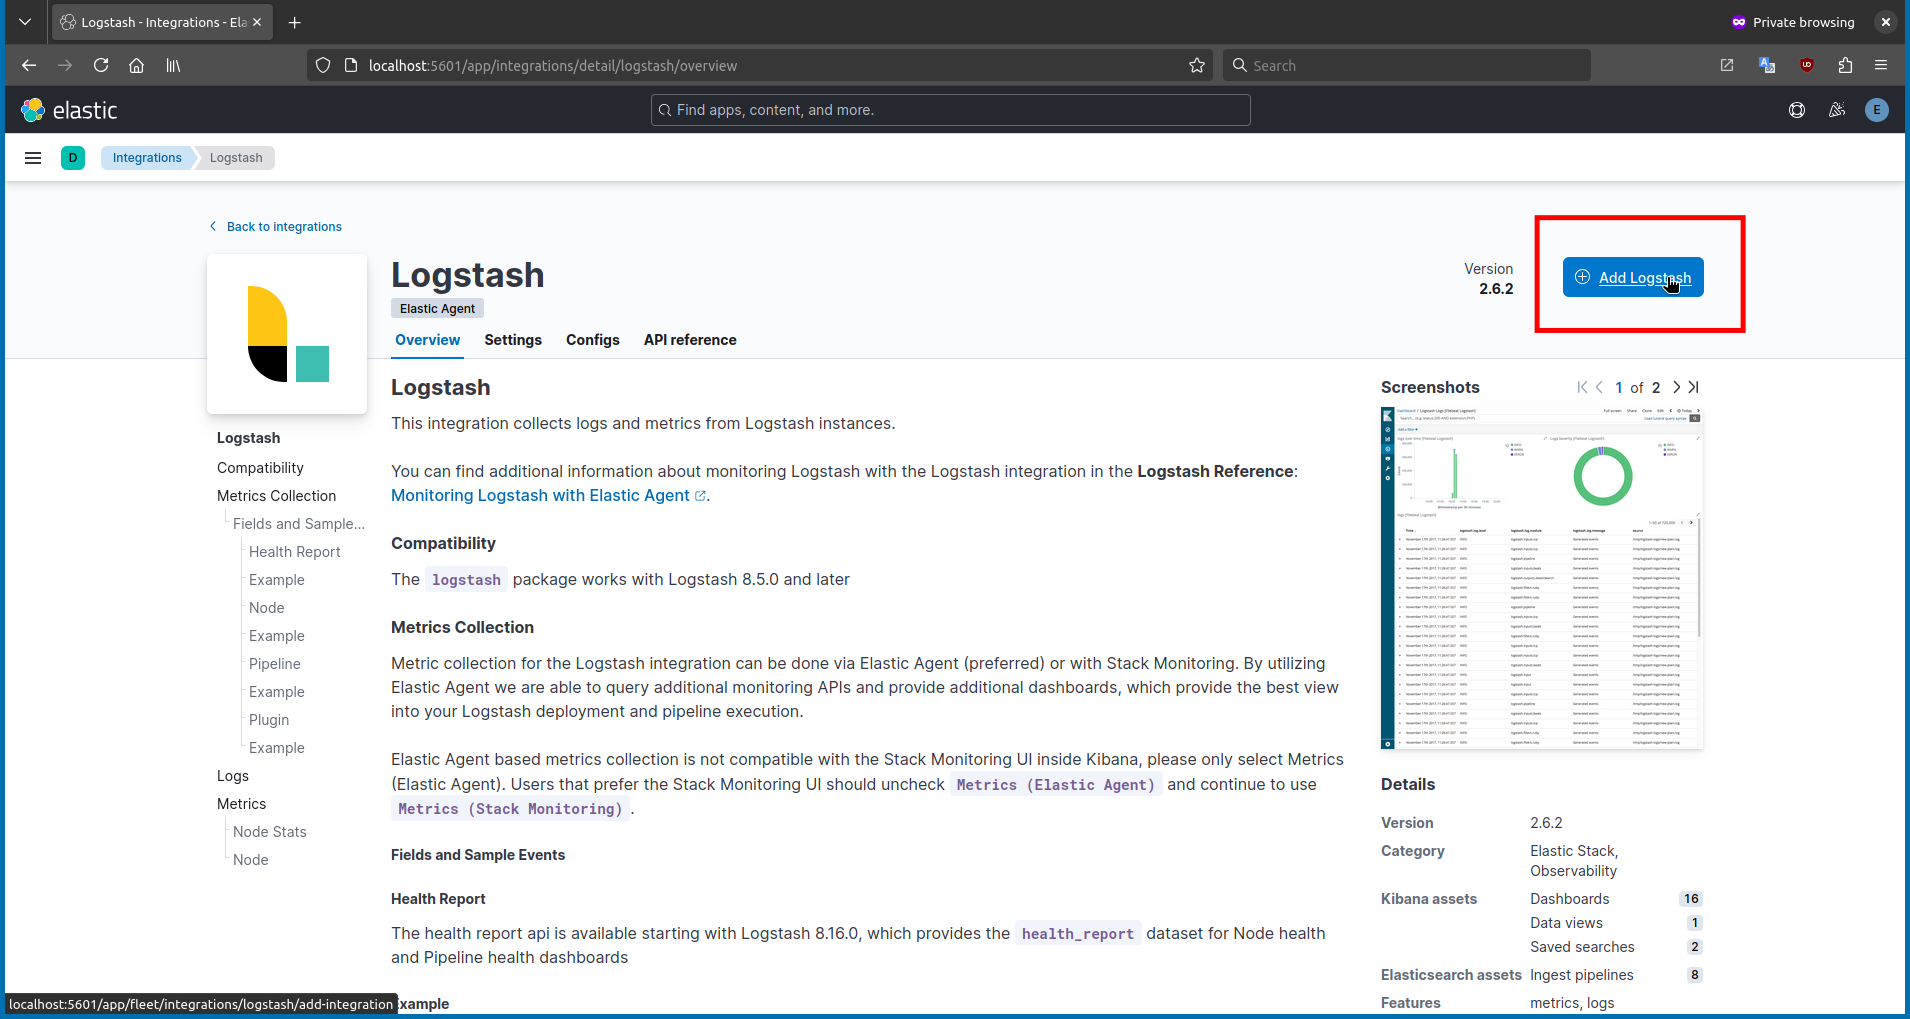
If you have successfully completed everything up to this step, you are ready to set up the Logstash integration for Kibana. In Kibana, click on the search bar and type
Logstash.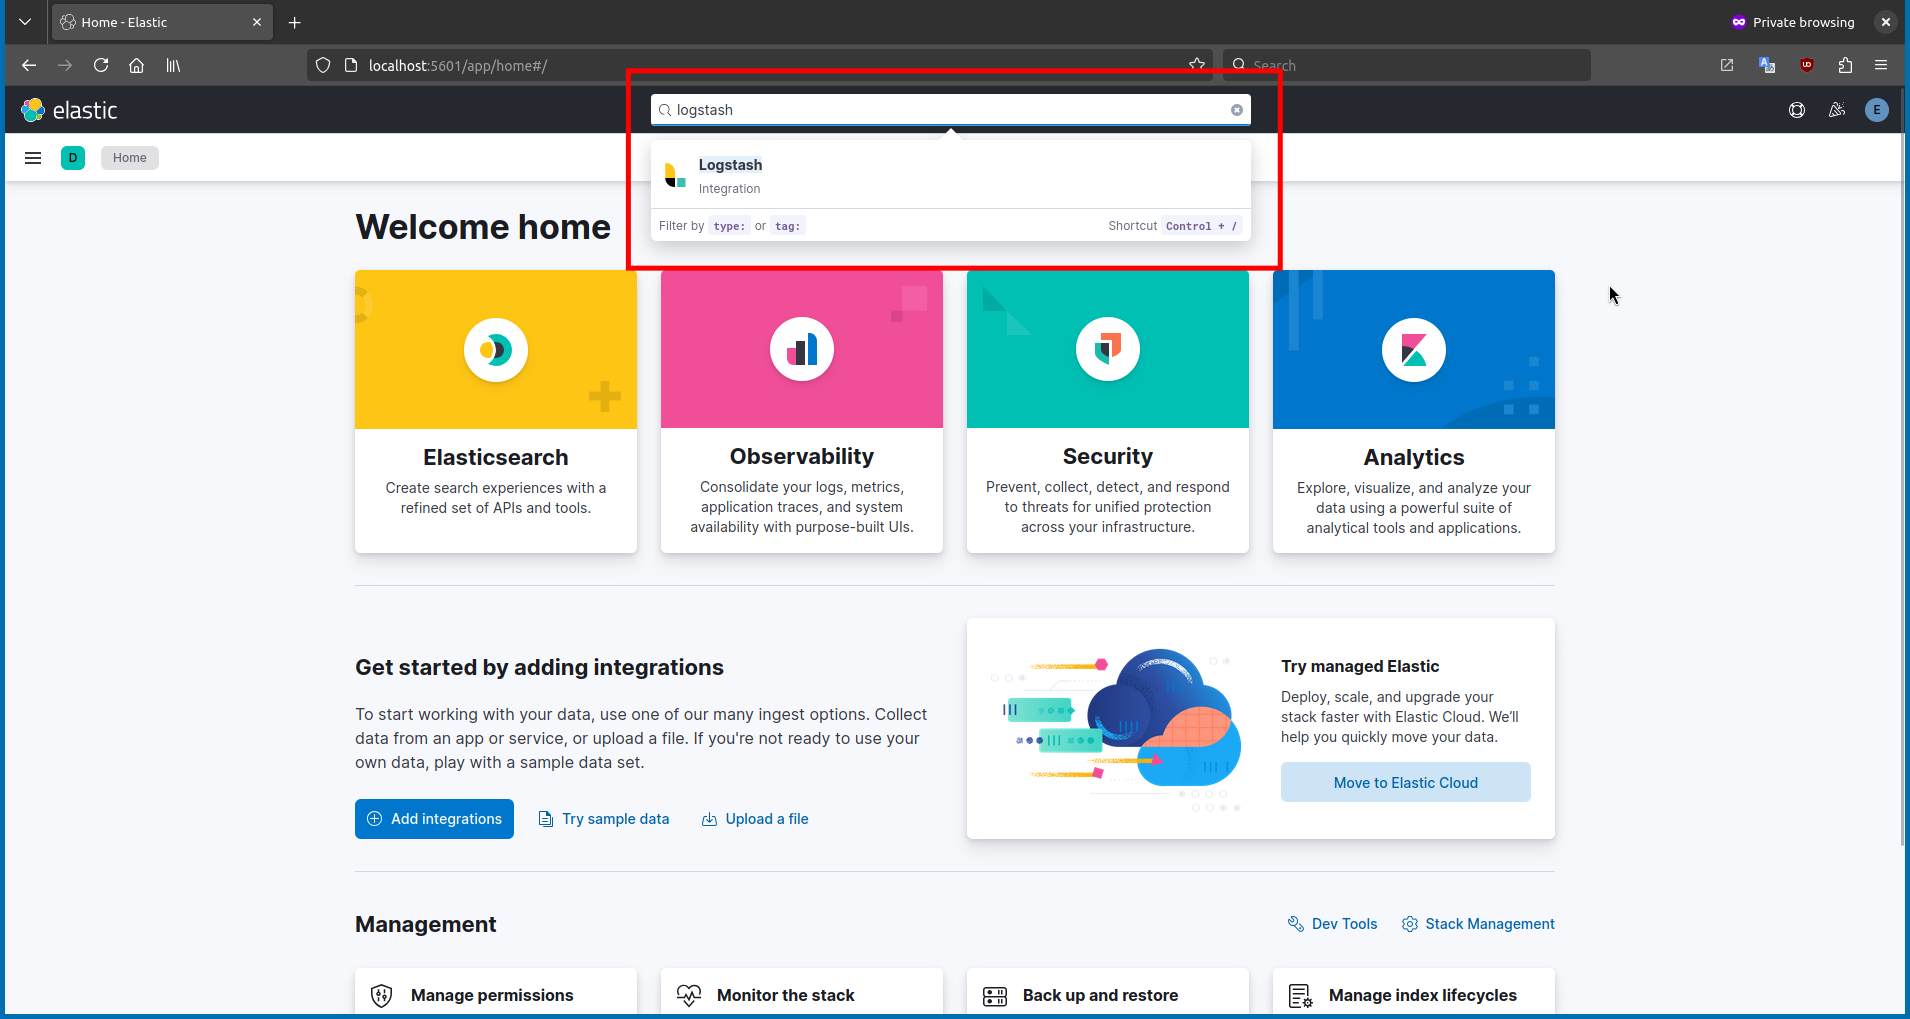
Step 9 - Configure Filebeat
-
The next step is to configure Filebeat for log collection. Open the Filebeat configuration file and add this block to
filebeat.inputs. In this tutorial, I will use the Caddy web server as an example. You can replace thecaddyservice with your own service.sudo vim /etc/filebeat/filebeat.yml- type: filestream id: caddy-access-logs enabled: true paths: - /var/log/caddy/*.log json: keys_under_root: true overwrite_keys: true add_error_key: true message_key: msg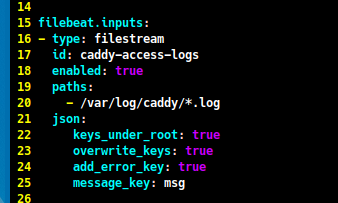
-
Then, scroll down to the
output.elasticsearchsection and comment out theoutput.elasticsearchandpresetlines. After that, uncomment theoutput.logstashsection and thehostsline.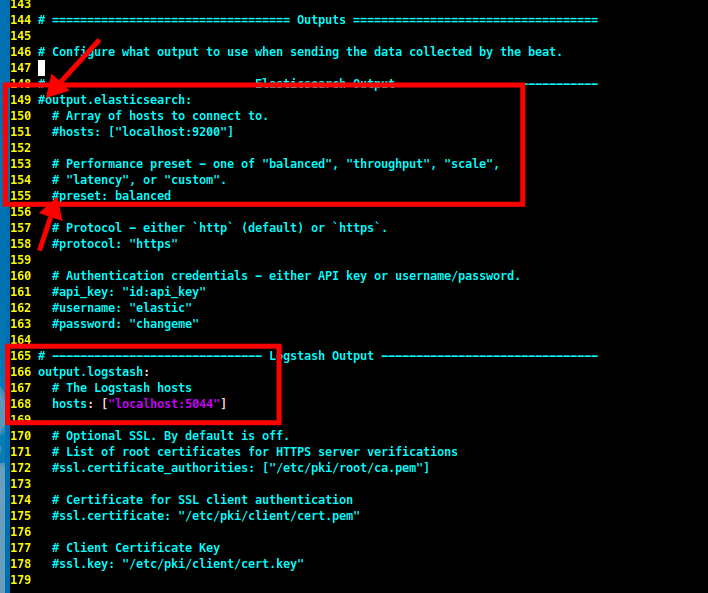
Step 10 - Create Logstash Users and Roles
-
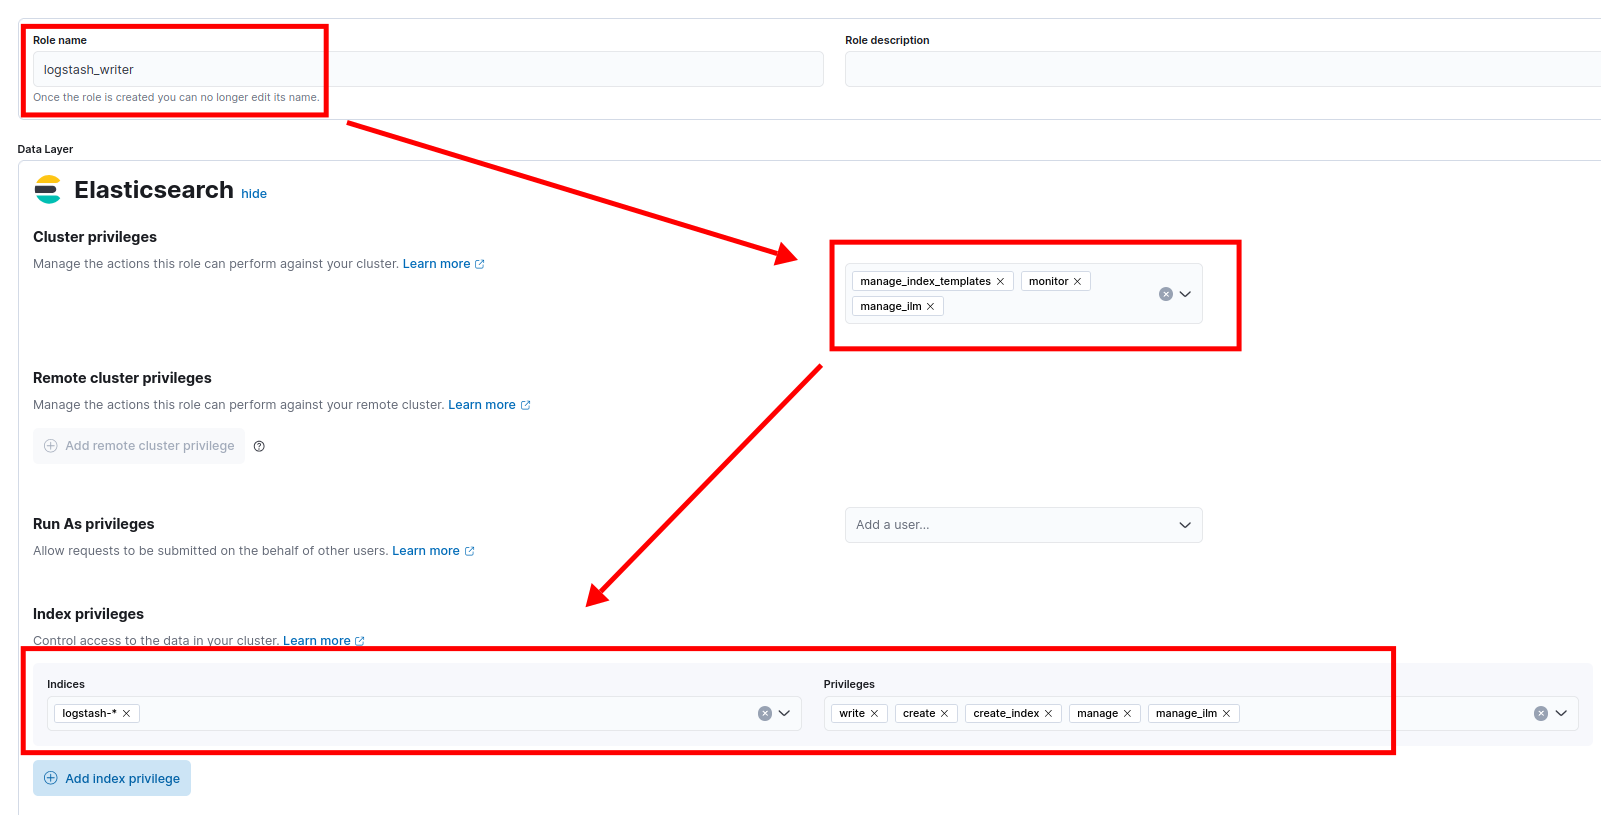
The next step is to create Logstash users and roles. Open the Kibana interface in your web browser and navigate to
Stack Management>Roles>Create role.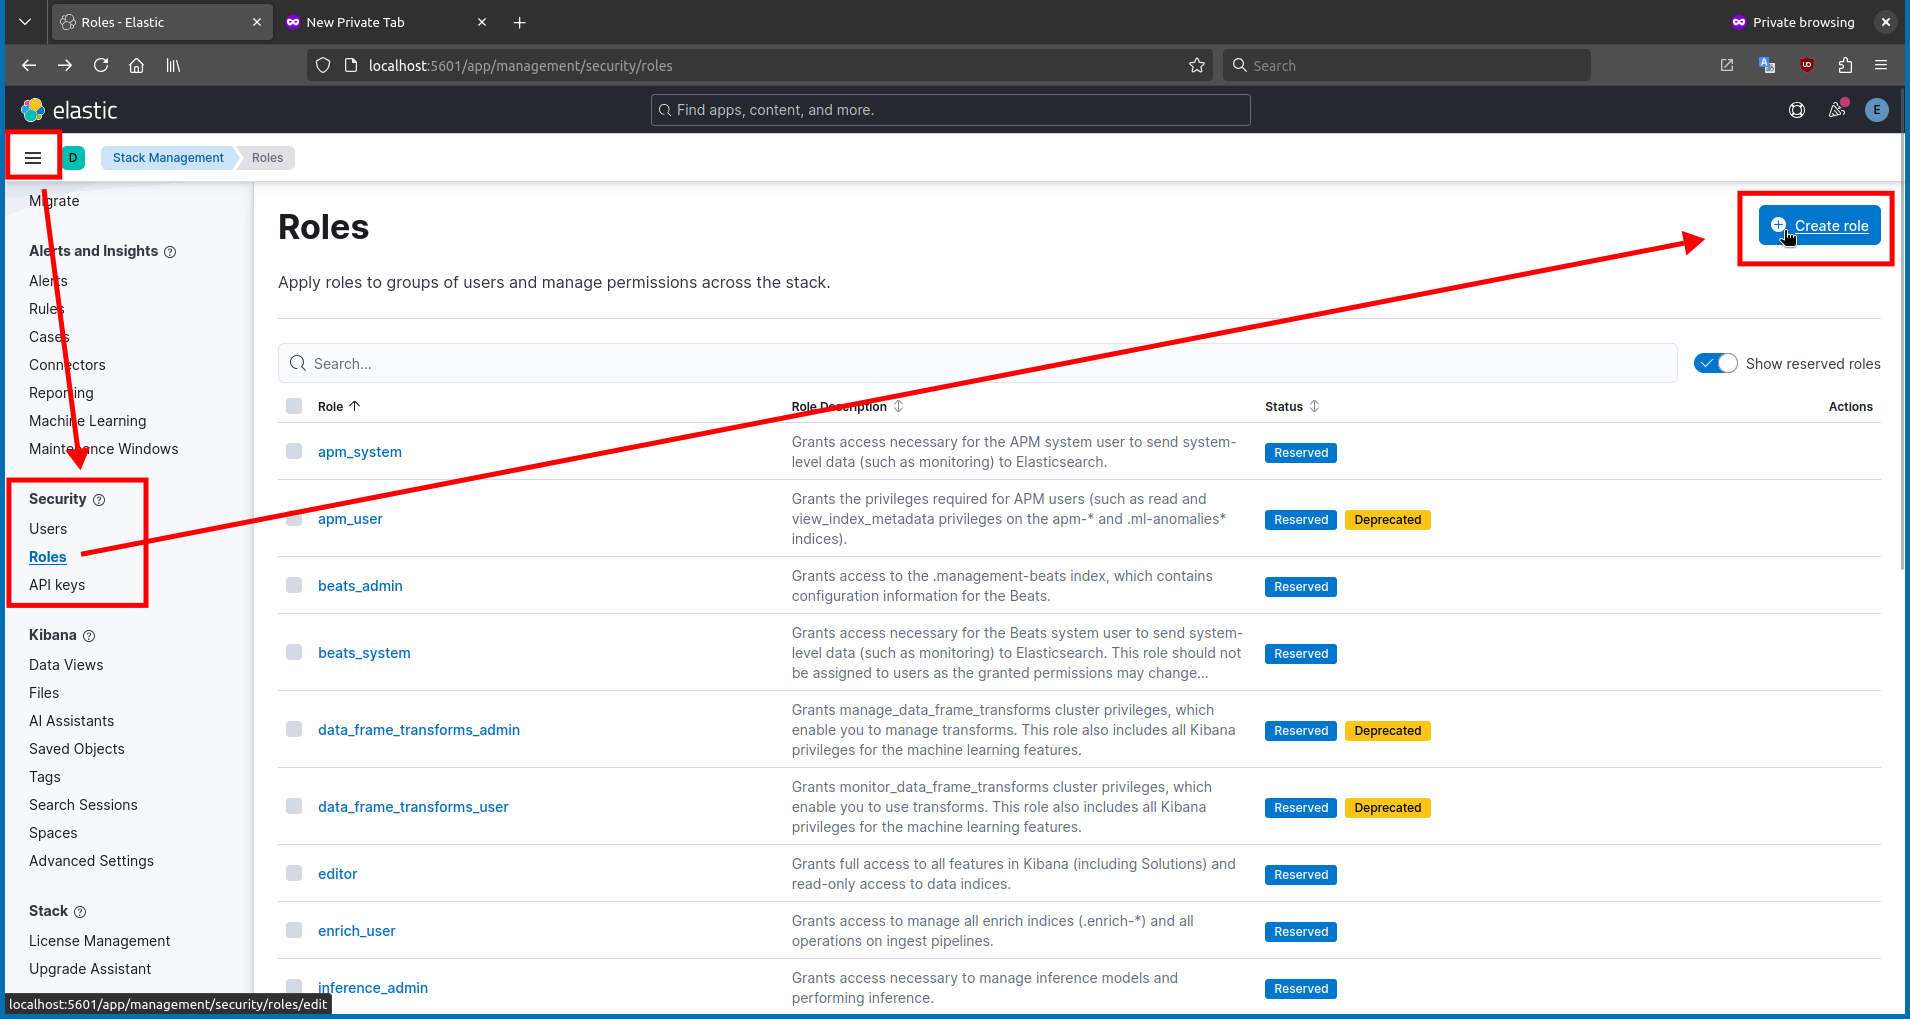
-
Create a new role with the following settings:
- Role name:
logstash_writer - Cluster privileges:
manage,manage_index_templates,monitor - Index privileges:
- name:
logstash-* - privileges:
create_index,create,write,delete,read
- name:
- Role name:
-
After that, navigate to
Stack Management>Users>Create user.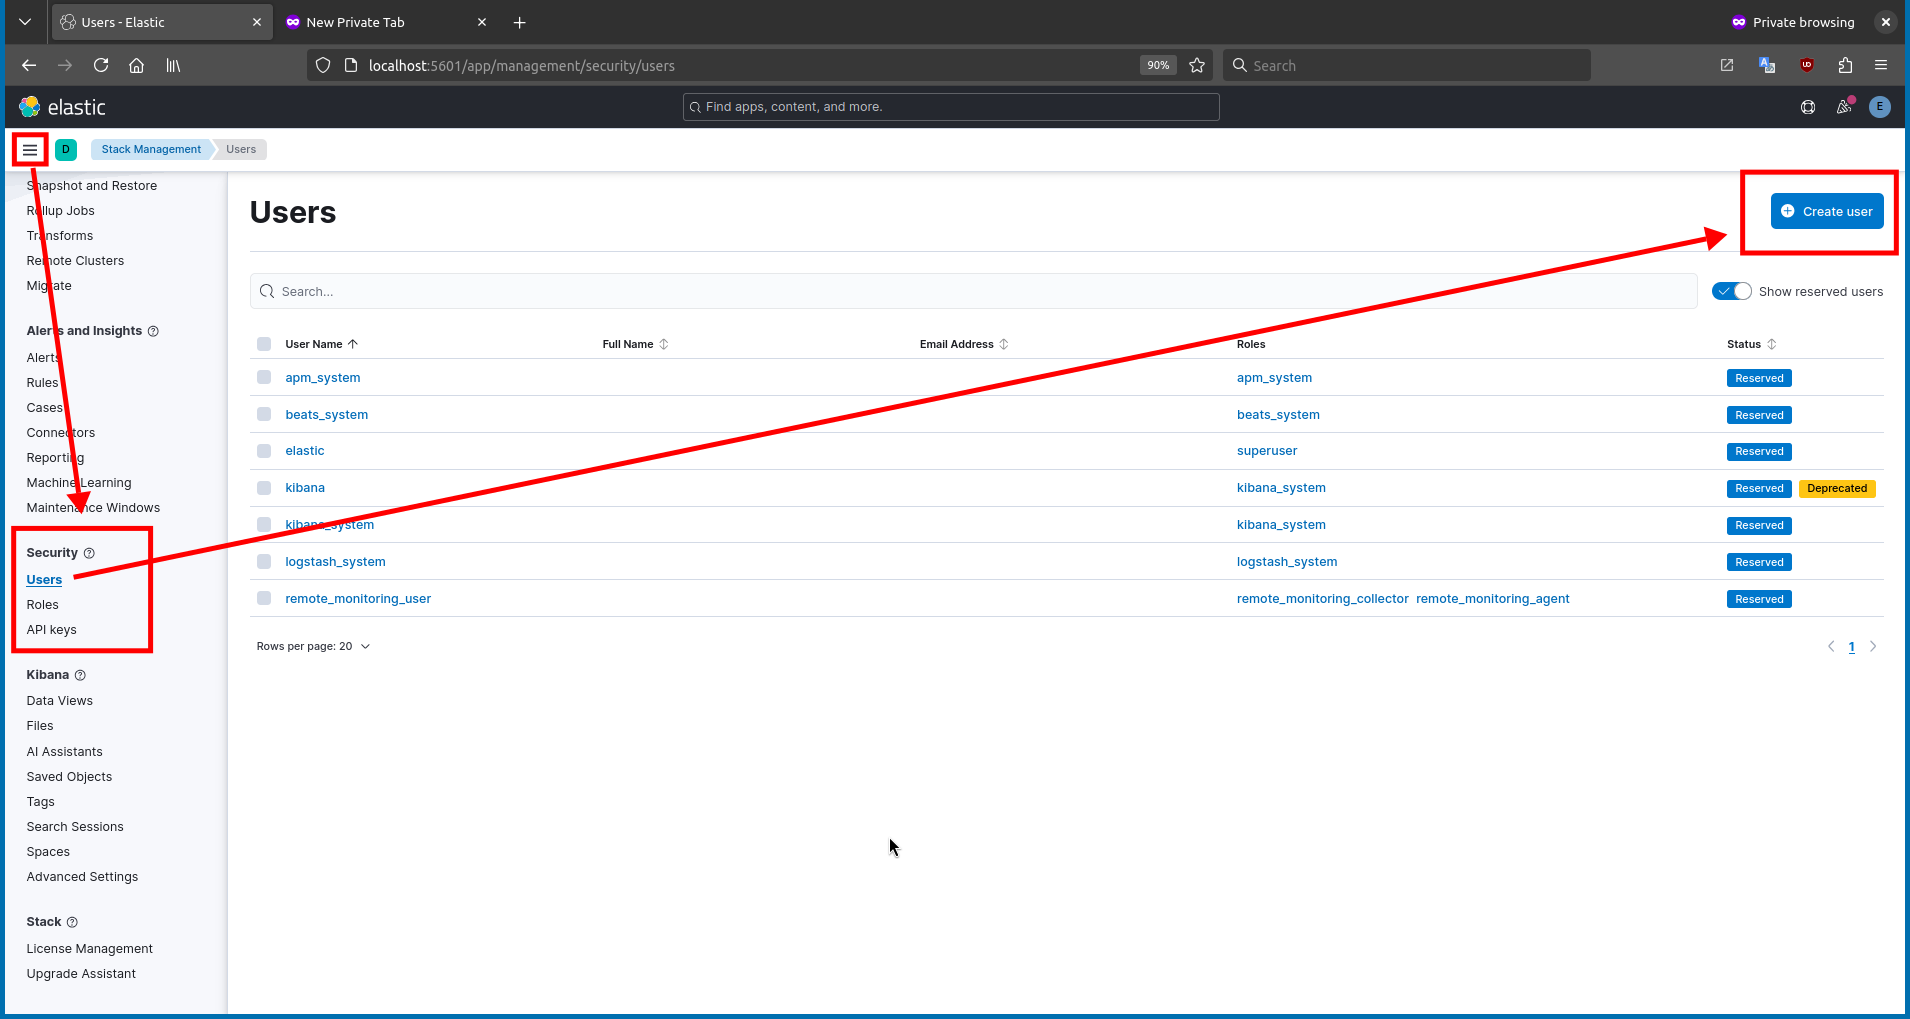
-
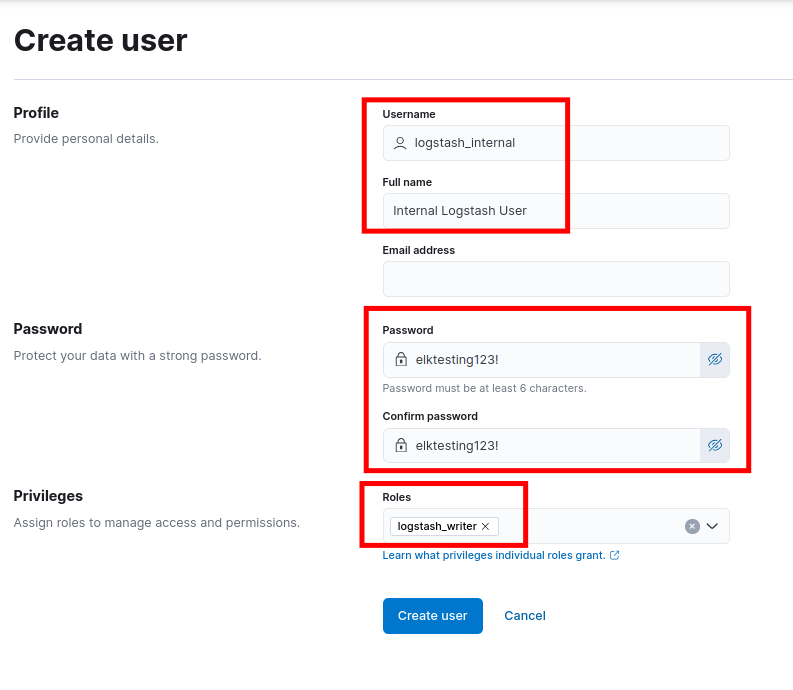
Create a new user with the following settings:
- Profile:
logstash_internal - Full name:
Logstash Internal User - Password:
my_secret_strong_password - Roles:
logstash_writer
- Profile:
-
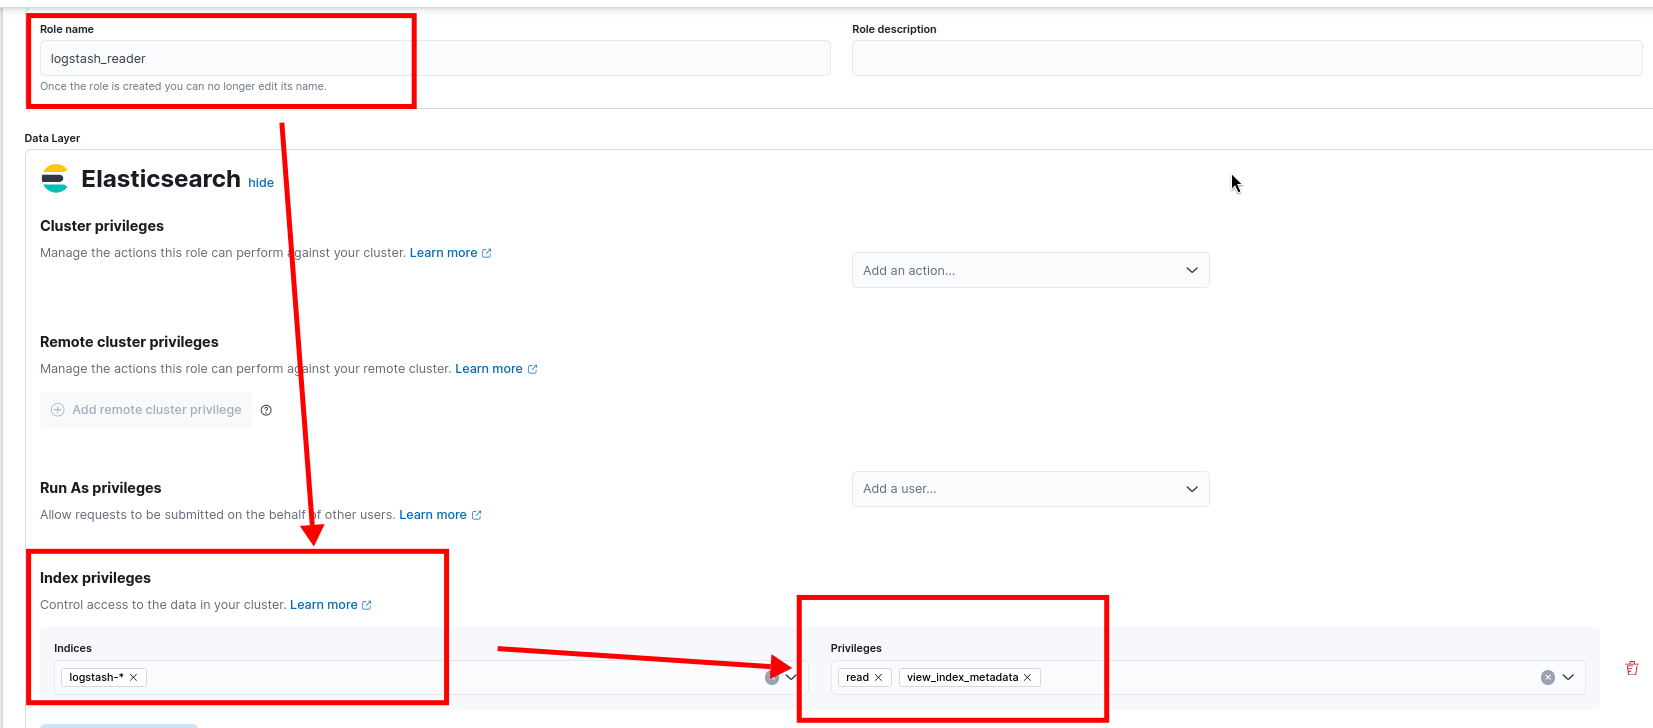
Then, navigate to
Stack Management>Roles>Create role.
-
Create a new role with the following settings:
- Role name:
logstash_reader - Cluster privileges:
monitor - Index privileges:
- name:
logstash-* - privileges:
read
- name:
- Role name:
-
Finally, navigate to
Stack Management>Users>Create userforlogstash_user.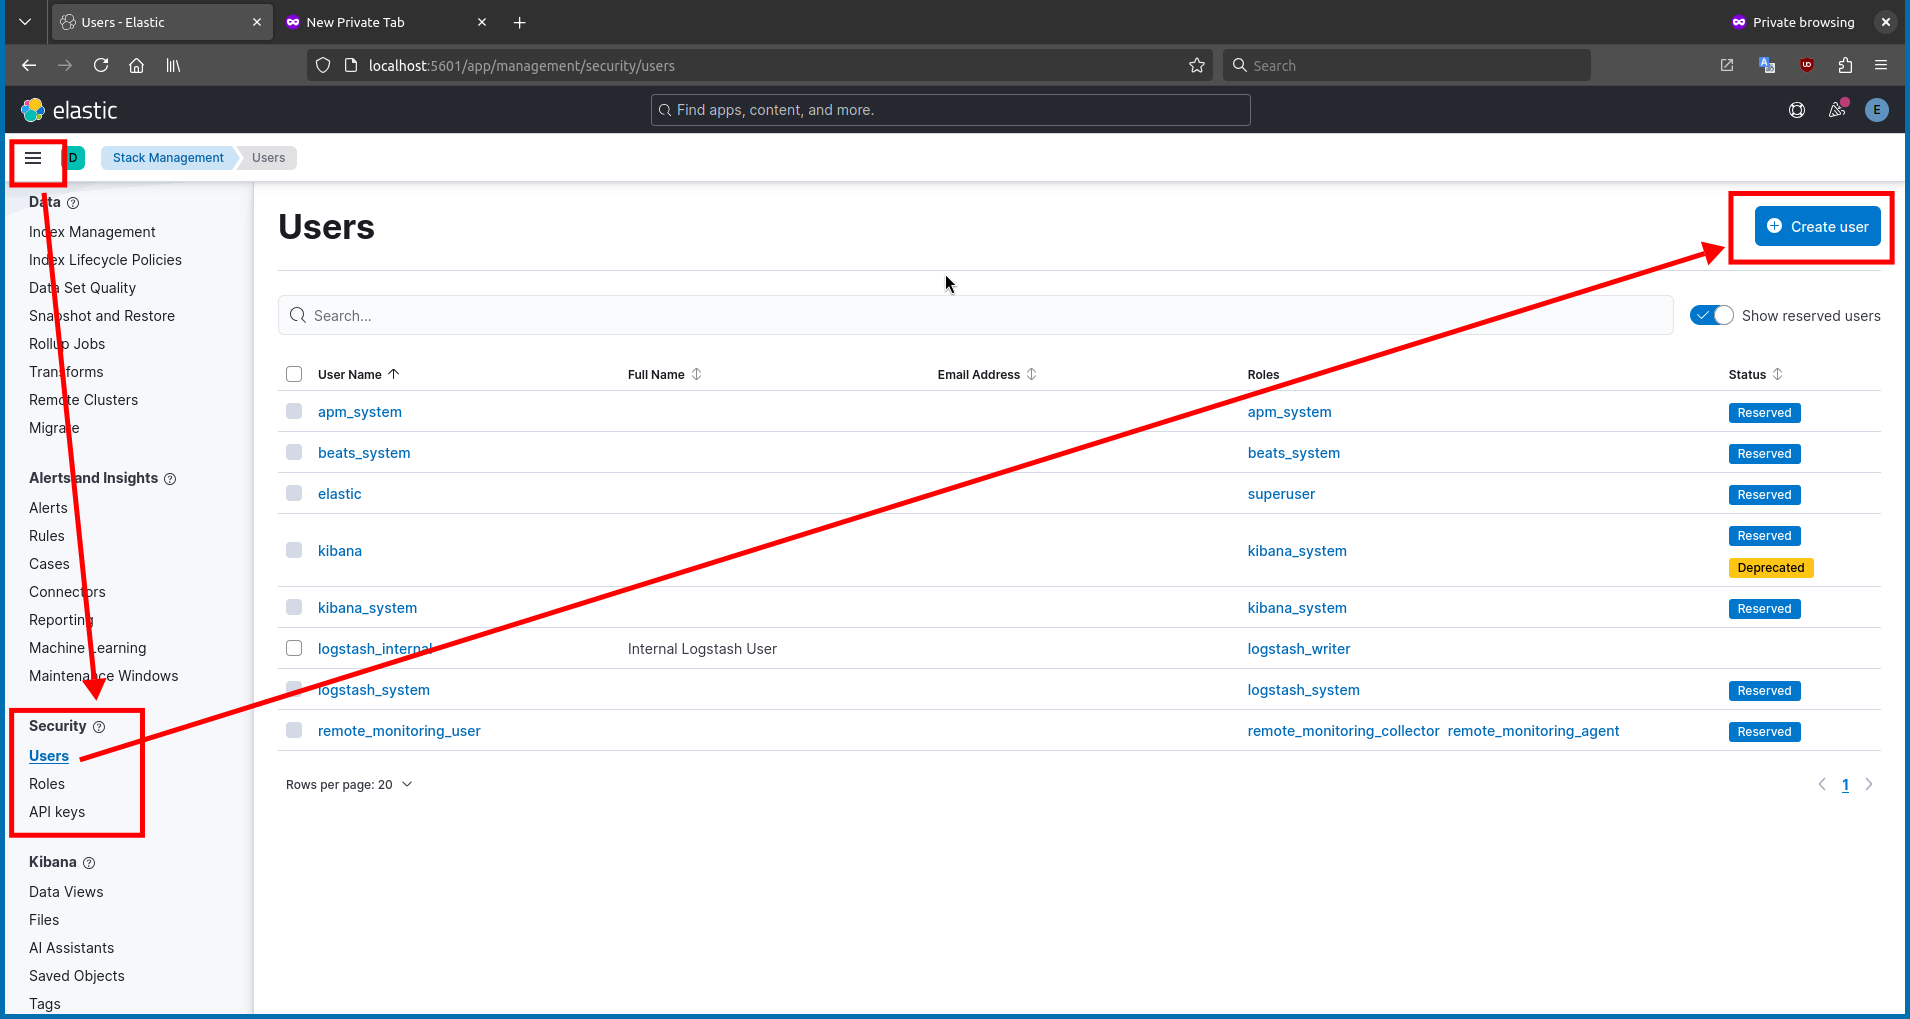
-
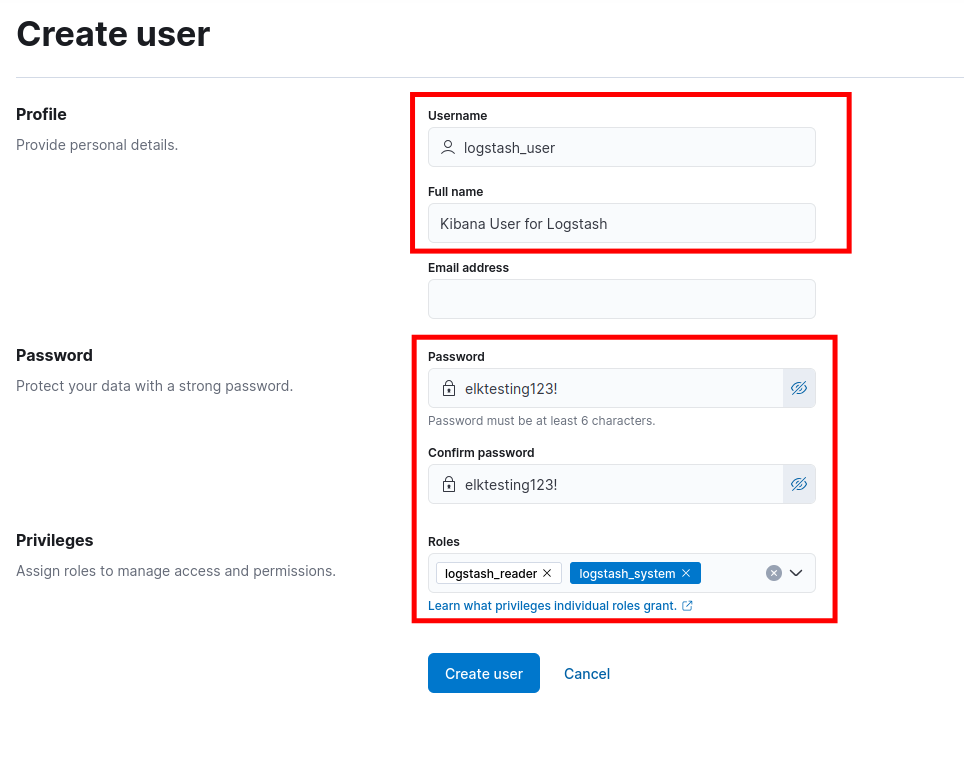
Create a new user with the following settings:
- Profile:
logstash_user - Full name:
Kibana User for Logstash - Password:
my_secret_strong_password - Roles:
logstash_reader,logstash_system
- Profile:
Step 11 - Configure Logstash
-
The next step is to configure Logstash. I’m using the Caddy web server as an example. So, I’m using filters to parse the Caddy access logs. Open the Logstash configuration file and add the following block:
sudo vim /etc/logstash/conf.d/caddy.confinput { beats { port => 5044 } } # If you using another service, replace filter block with your service filter { json { source => "message" target => "parsed_json" } date { match => ["[parsed_json][ts]", "YYYY/MM/dd HH:mm:ss"] target => "@timestamp" } mutate { rename => { "[parsed_json][request][remote_ip]" => "[client][ip]" "[parsed_json][request][method]" => "[http][request][method]" "[parsed_json][request][uri]" => "[url][path]" "[parsed_json][status]" => "[http][response][status_code]" "[parsed_json][duration]" => "[event][duration]" "[parsed_json][bytes_read]" => "[http][request][body][bytes]" } add_field => { "[http][version]" => "%{[parsed_json][request][proto]}" "[service][name]" => "caddy" "[observer][ip]" => "%{[parsed_json][request][host]}" } } mutate { remove_field => [ "message", "parsed_json", "logger", "level", "resp_headers" ] } } output { elasticsearch { hosts => ["https://localhost:9200"] index => "logstash-%{+YYYY.MM.dd}" ssl => true ssl_certificate_authorities => ["/etc/elasticsearch/certs/http_ca.crt"] user => "logstash_internal" password => "elktesting123!" } }Important Notes
-
If you want to use custom index name, replace
logstash-%{+YYYY.MM.dd}with your custom index name. And change thelogstash-*pattern to future steps. -
In this tutorial, I have installed the ELK stack on a single node. So I’m adding the
logstashgroup to theelasticsearchuser. If you have a multi-node setup, copy the/etc/elasticsearch/certs/http_ca.crtfile to the logstash server.sudo usermod -aG elasticsearch logstash
-
-
Then enable the filebeat and logstash services to start on boot and run them immediately:
sudo systemctl enable --now filebeat logstash
Step 12 - Add Data Views in Kibana
-
The next step is to add data views in Kibana. Open the Kibana interface in your web browser and navigate to
Stack Management>Kibana>Data views.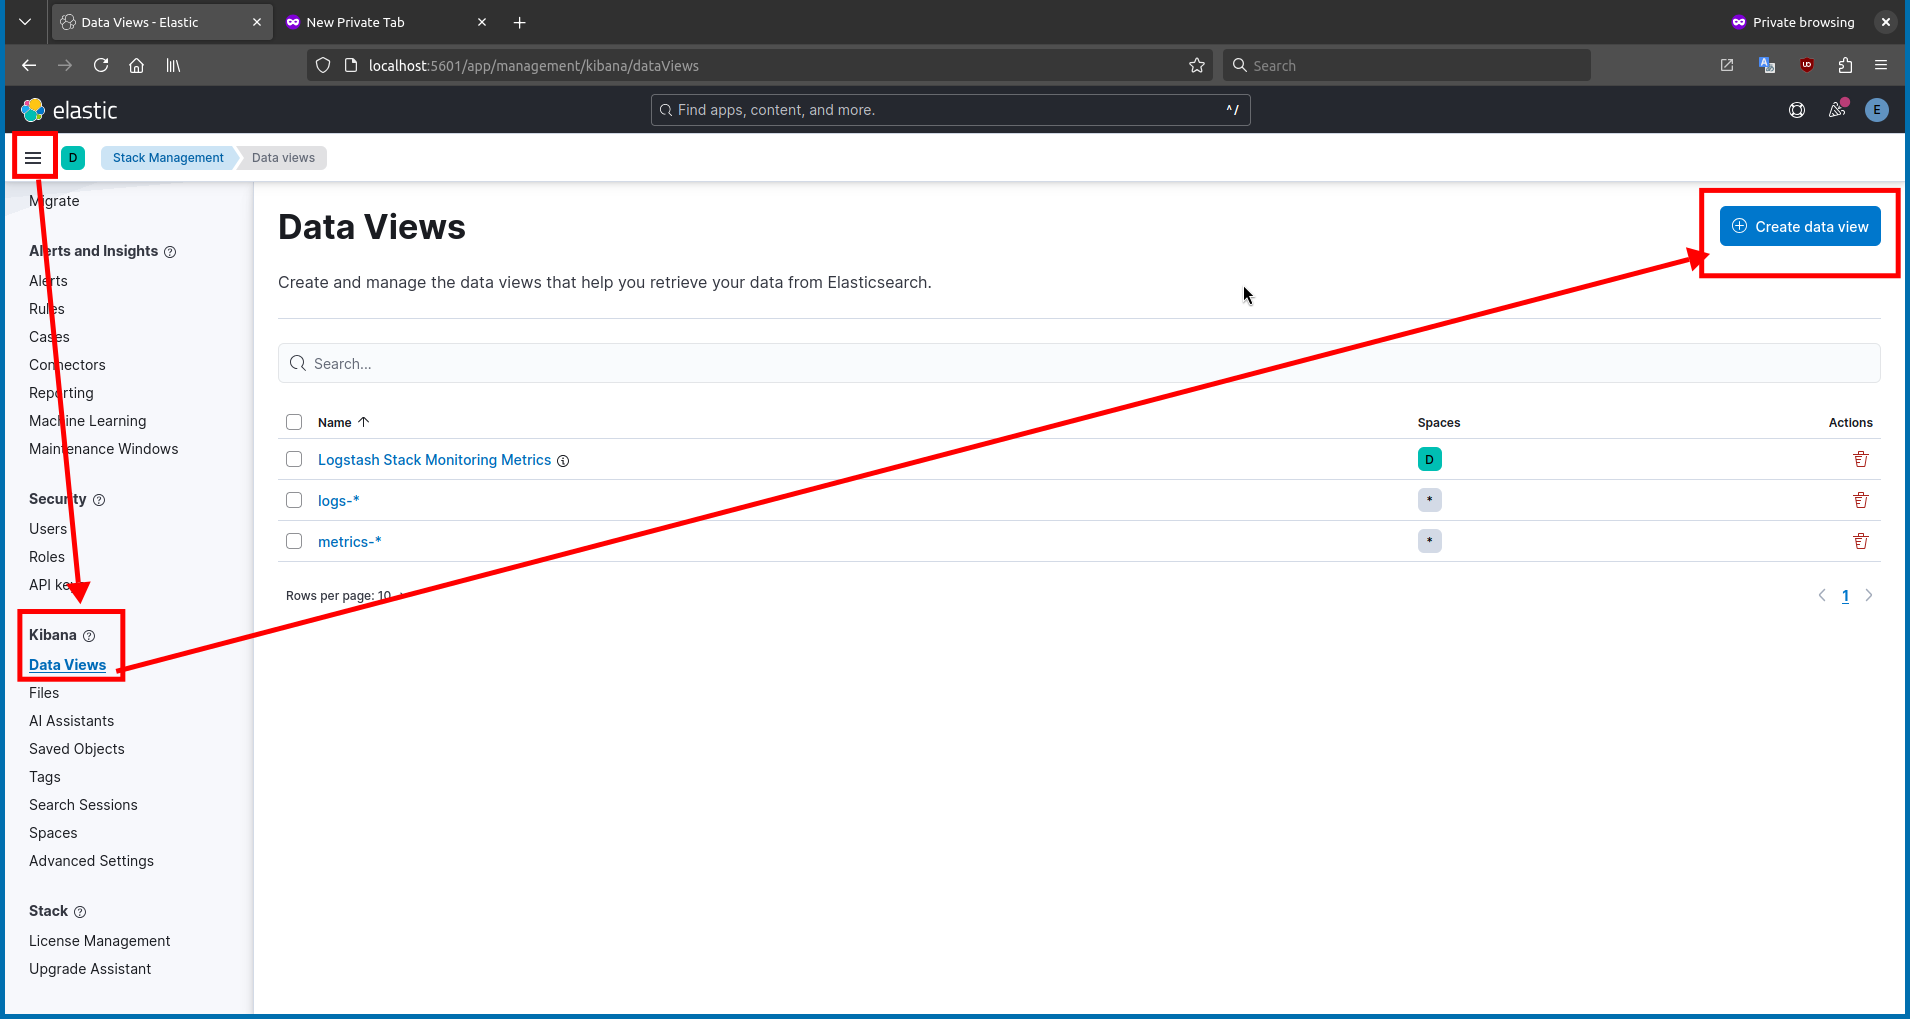
-
Then, click the
Create data viewbutton and fill in the details with the following settings:- Index pattern:
logstash-* - Time field:
@timestamp - Title:
Caddyserver Data View

- Index pattern:
-
After that, navigate to
Analytics>Discoverand select theCaddyserver Data Viewfrom the dropdown.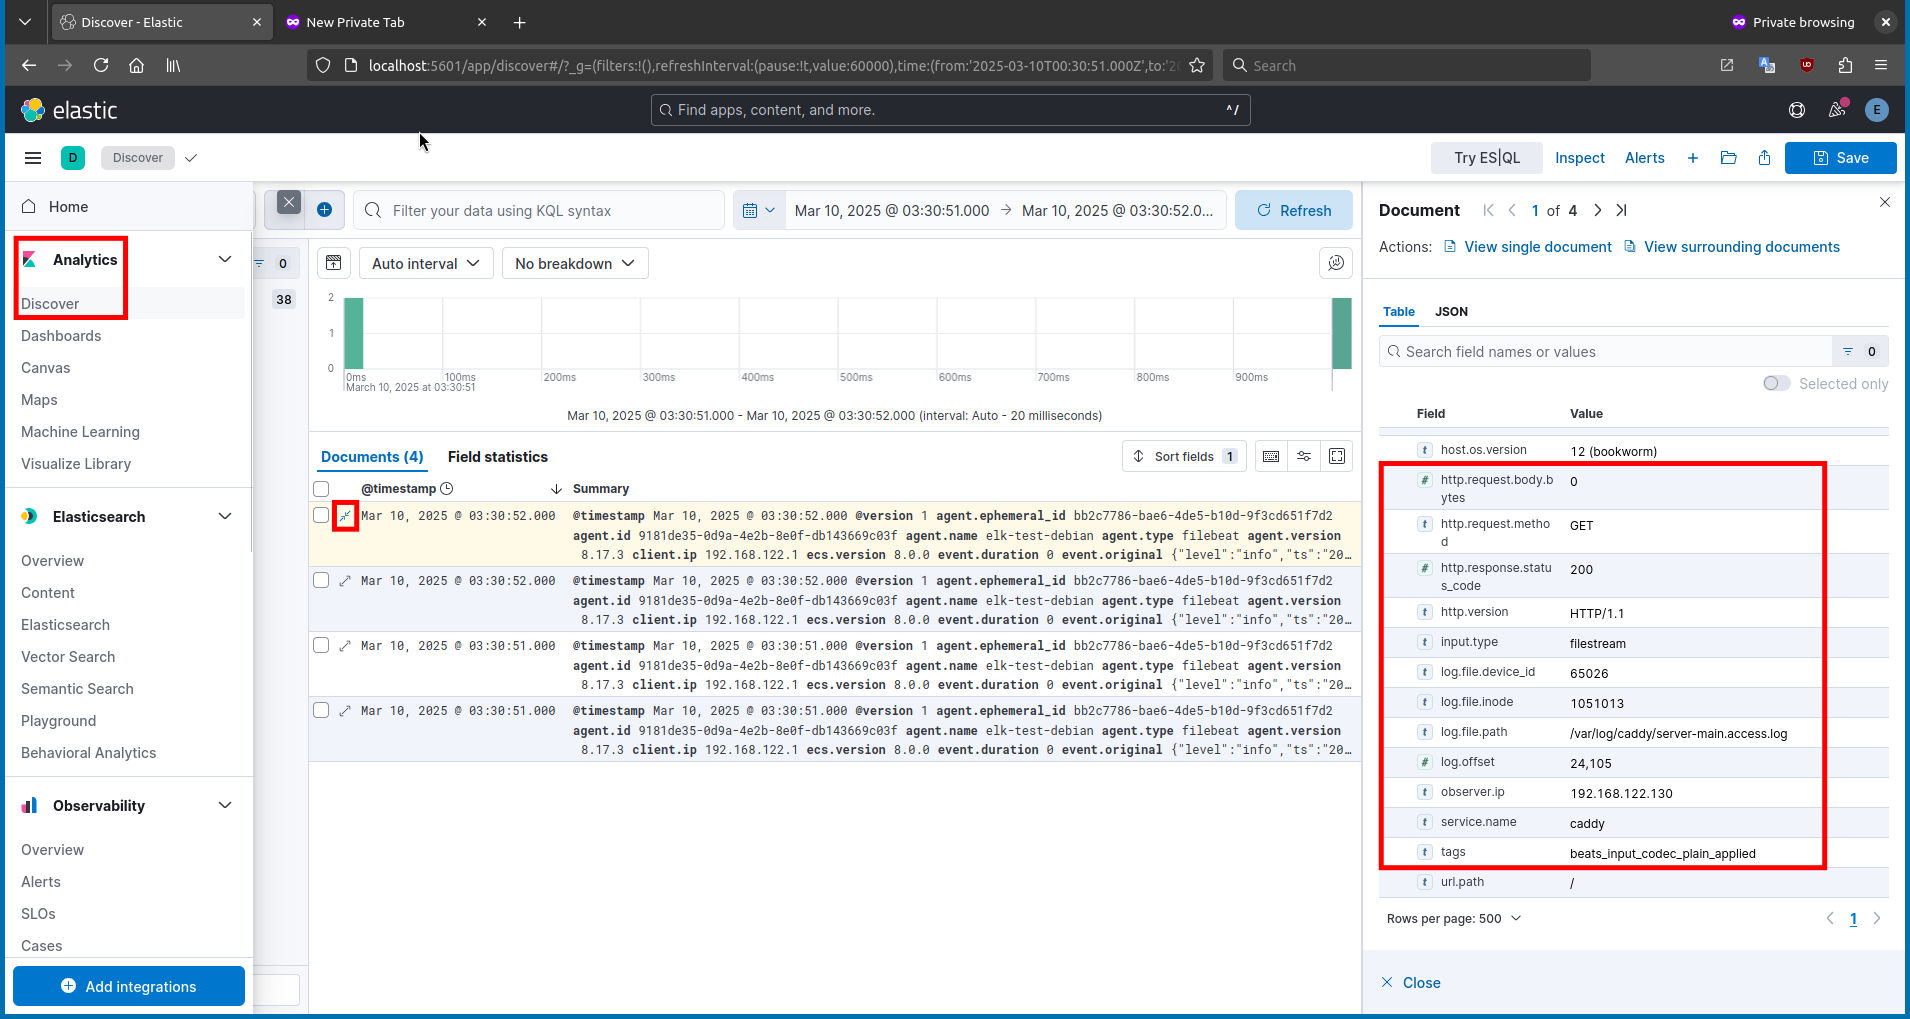
Conclusion
- Installing and configuring the ELK stack provides a robust foundation for efficiently ingesting, processing, and visualizing large amounts of data. In this guide, you’ve learned how the integration of Elasticsearch, Logstash, and Kibana can streamline your log management and data analysis processes. With its flexible and scalable architecture, the ELK stack enables you to monitor system performance, perform security analysis, and gain operational insights. This powerful toolset supports data-driven decision making across a broad spectrum, from IT operations to business intelligence.
References
- https://portforwarded.com/install-elastic-elk-stack-8-x-on-ubuntu-22-04-lts/
- https://filipporigoni.medium.com/install-elk-stack-8-on-debian-12-37d52c824d3a
- https://www.elastic.co/guide/en/elasticsearch/reference/current/deb.html
- https://www.elastic.co/guide/en/elasticsearch/reference/current/built-in-users.html
- https://www.elastic.co/guide/en/logstash/8.17/ls-security.html