Disclaimer
In this guide, I will use Fedora 41 Cloud Edition as the base operating system. Some steps may vary depending on the distribution you are using.
Introduction
- Grafana is a multi-platform open-source analytics and interactive visualization web application. It provides charts, graphs, and alerts for the web when connected to supported data sources. Prometheus Node Exporter is a Prometheus exporter for hardware and OS metrics exposed by *NIX kernels, written in Go with pluggable metric collectors. In this guide, we will install and configure Grafana and Prometheus Node Exporter
Step 1: Install Prometheus and Node Exporter
-
The first step, we need to install Prometheus and Node Exporter. We will install it from the official repository. Run the following commands to install them:
-
For Debian/Ubuntu:
sudo apt update sudo apt install prometheus-node-exporter prometheus -
For CentOS/RHEL:
sudo yum install epel-release sudo yum install golang-github-prometheus-node-exporter golang-github-prometheus -
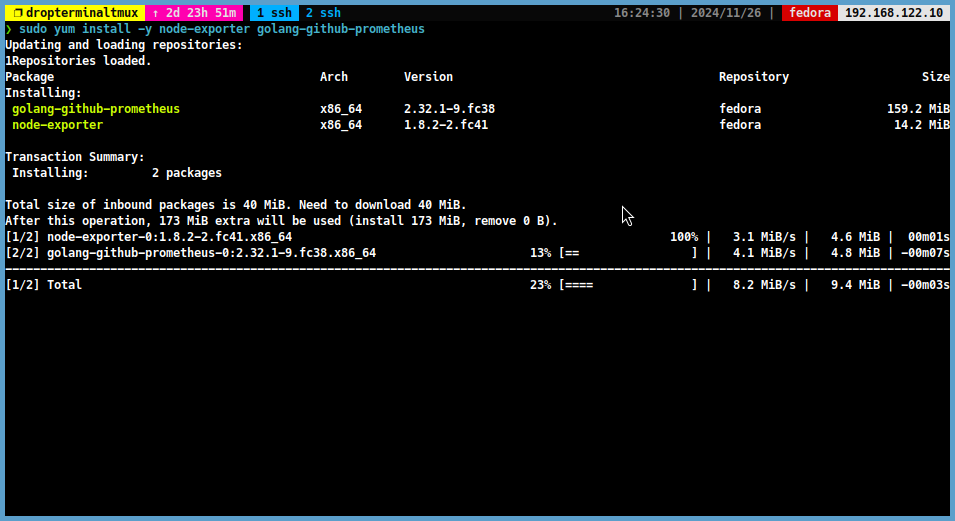
For Fedora:
sudo dnf install node-exporter golang-github-prometheus
i
-
-
After installing this packages, start and enable the services:
sudo systemctl enable --now prometheus-node-exporter prometheus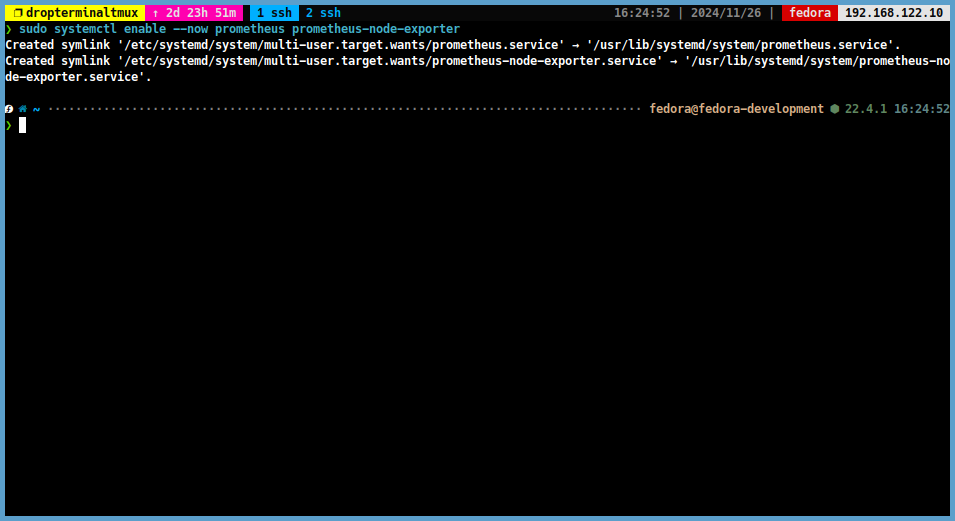
Step 2: Install Grafana
Method 1: Install Grafana from Repository
-
In the next step, we will install Grafana from the official repository. If you want to use Grafana in Docker, you can skip this method. Run the following commands to install Grafana:
-
For Debian/Ubuntu:
-
First, install the required packages:
sudo apt update sudo apt-get install -y apt-transport-https software-properties-common wget -
Then, add the Grafana repository key and repository:
sudo mkdir -p /etc/apt/keyrings/
wget -q -O - https://apt.grafana.com/gpg.key | gpg --dearmor | sudo tee /etc/apt/keyrings/grafana.gpg > /dev/null
echo "deb [signed-by=/etc/apt/keyrings/grafana.gpg] https://apt.grafana.com stable main" | sudo tee -a /etc/apt/sources.list.d/grafana.list
sudo apt-get update
sudo apt-get install grafana
-
-
For CentOS/RHEL:
-
First, install the required packages:
sudo yum install -y wget -
Then, add the Grafana repository key:
wget -qO gpg.key https://rpm.grafana.com/gpg.key
sudo rpm --import gpg.key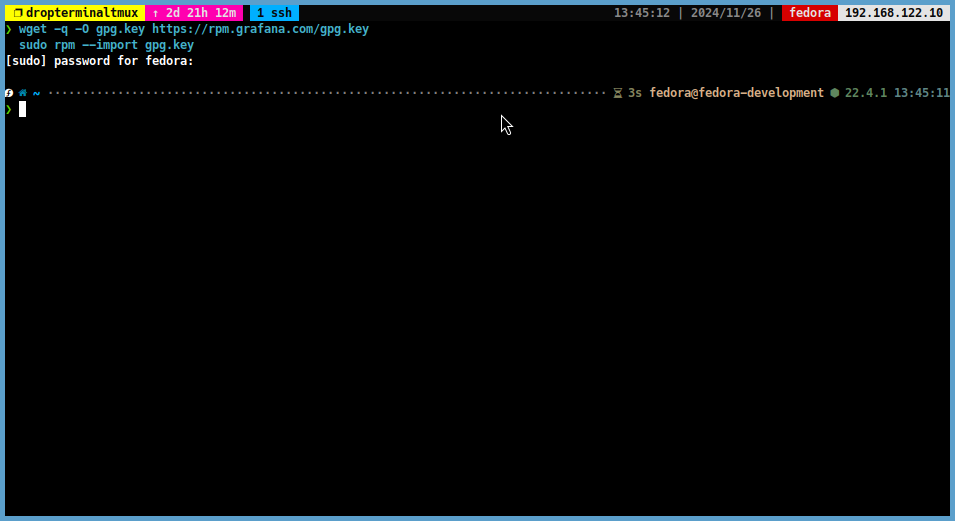
-
Create a file called
grafana.repoin the/etc/yum.repos.d/directory and add the following content:sudo vim /etc/yum.repos.d/grafana.repo[grafana] name=grafana baseurl=https://rpm.grafana.com repo_gpgcheck=1 enabled=1 gpgcheck=1 gpgkey=https://rpm.grafana.com/gpg.key sslverify=1 sslcacert=/etc/pki/tls/certs/ca-bundle.crt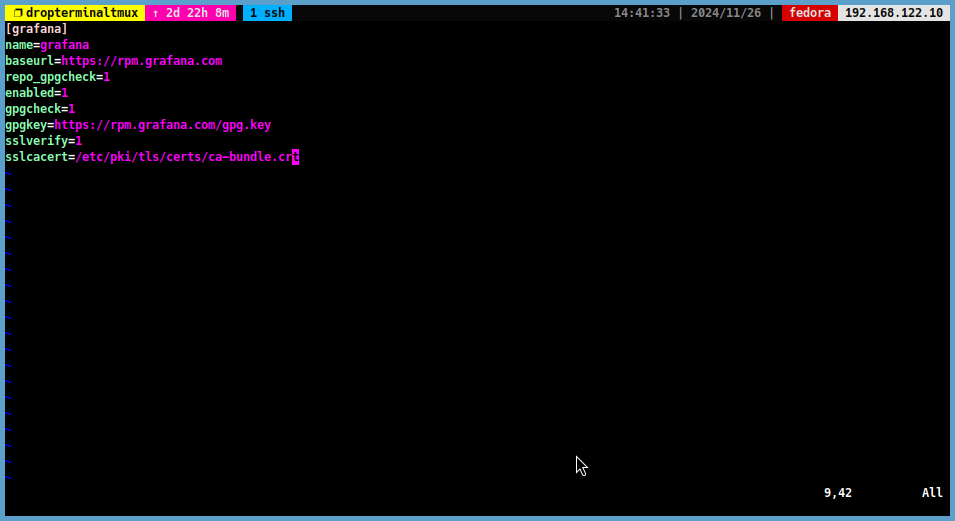
-
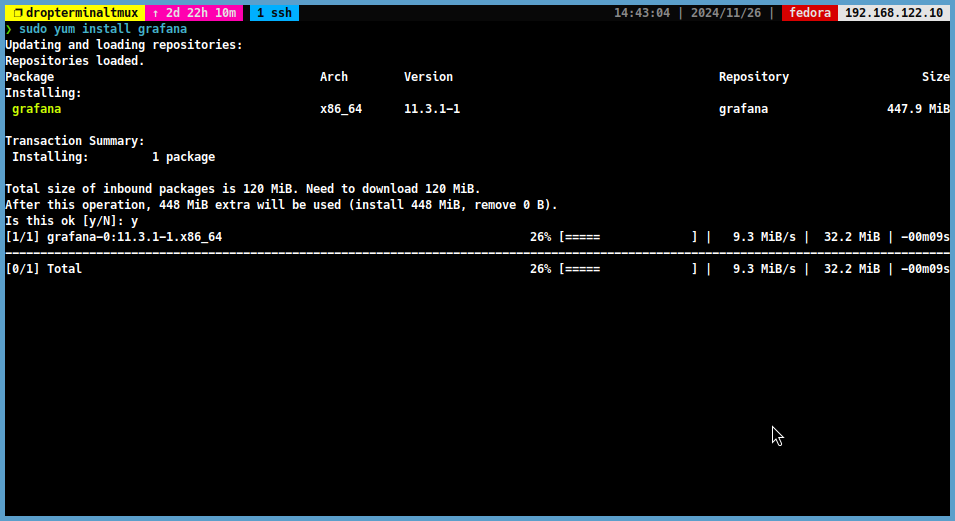
Then, install Grafana:
sudo yum update
sudo yum install grafana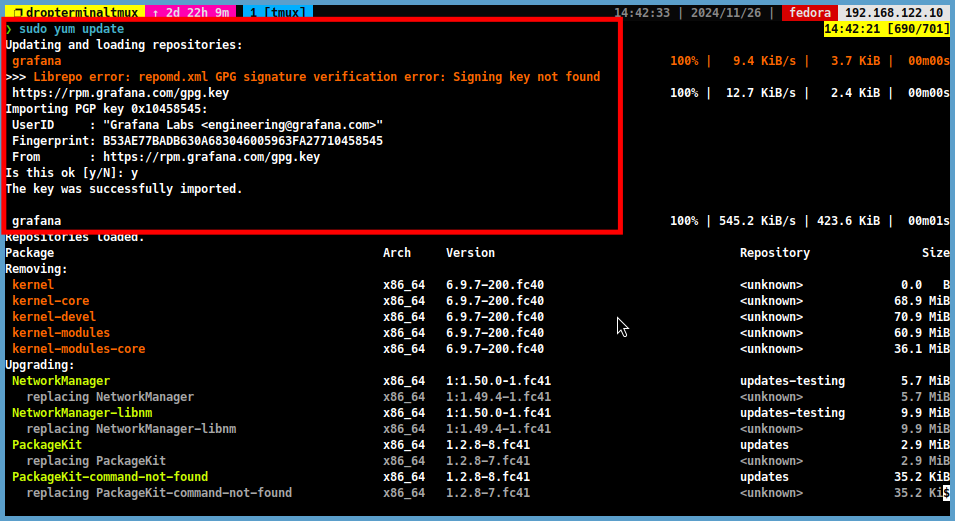
-
-
Method 2: Install Grafana in Docker
-
If you want to use Grafana in Docker, you can follow this step. Run the following commands to install Grafana in Docker:
-
First, install Docker:
curl -fsSL https://get.docker.com | sudo bash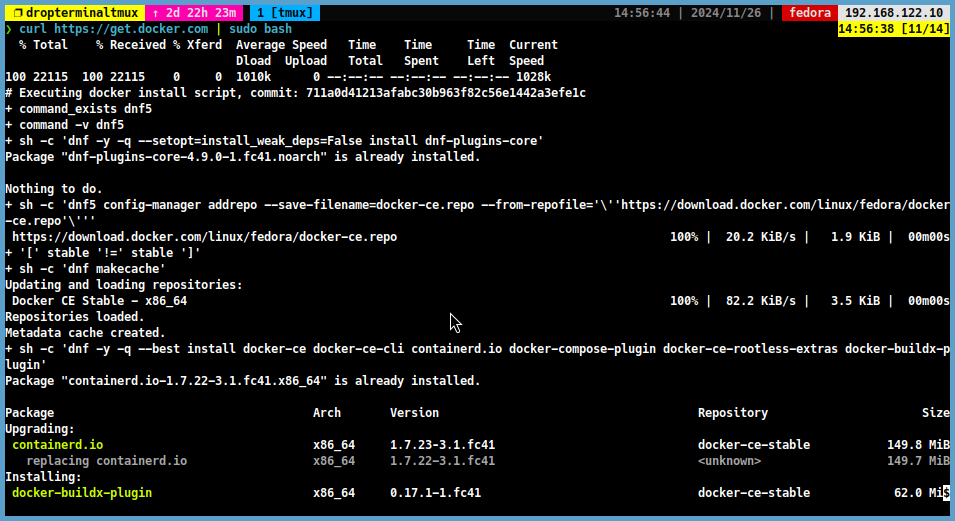
-
Then, start and enable the Docker service:
sudo systemctl enable --now docker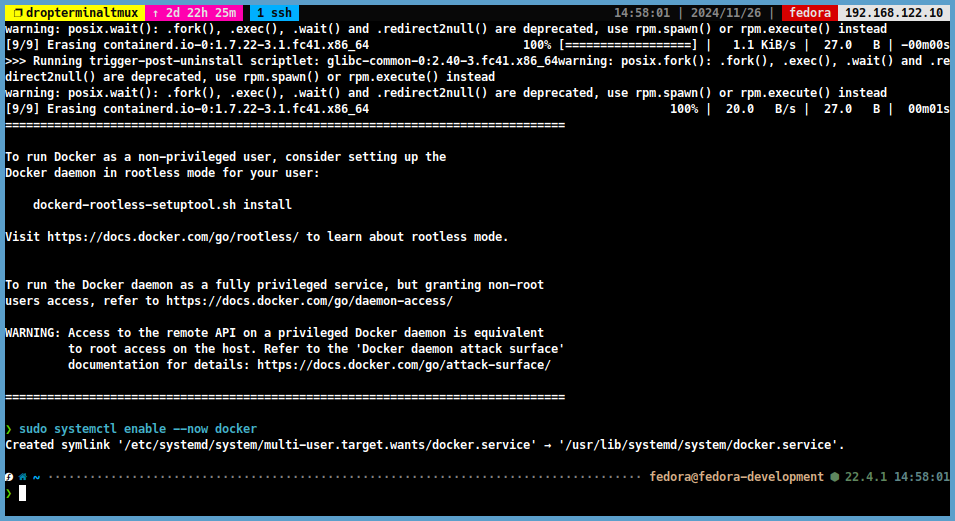
-
After installing Docker, create a data directory for Grafana:
sudo mkdir -p /opt/grafana/data -
Change the directory to
/opt/grafanaand create a file calleddocker-compose.yml:cd /opt/grafana sudo vim docker-compose.ymlservices: grafana: image: grafana/grafana:latest container_name: grafana restart: unless-stopped ports: - 3000:3000 volumes: - /opt/grafana/data:/var/lib/grafana -
Save the file and set the ownership of the directory:
sudo chown -R 472:472 /opt/grafana -
Then run the following command to start Grafana:
sudo docker compose up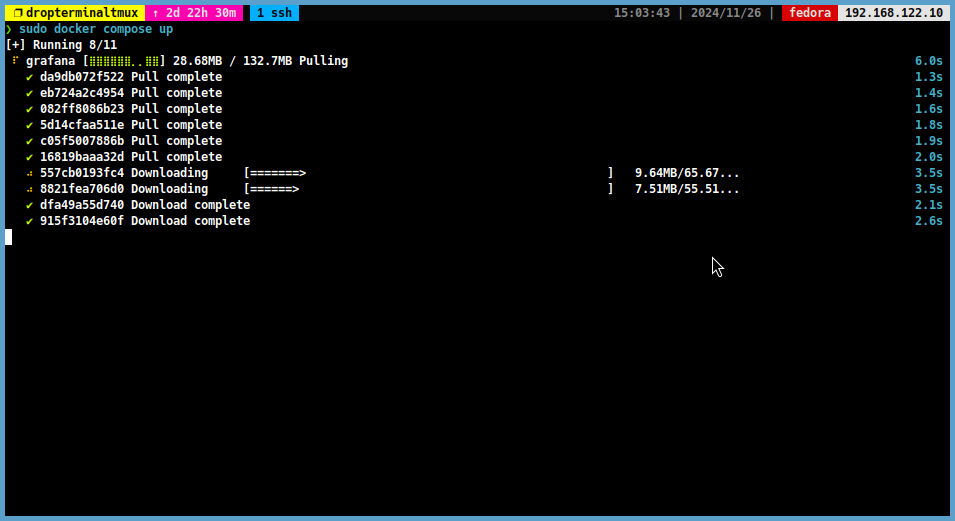
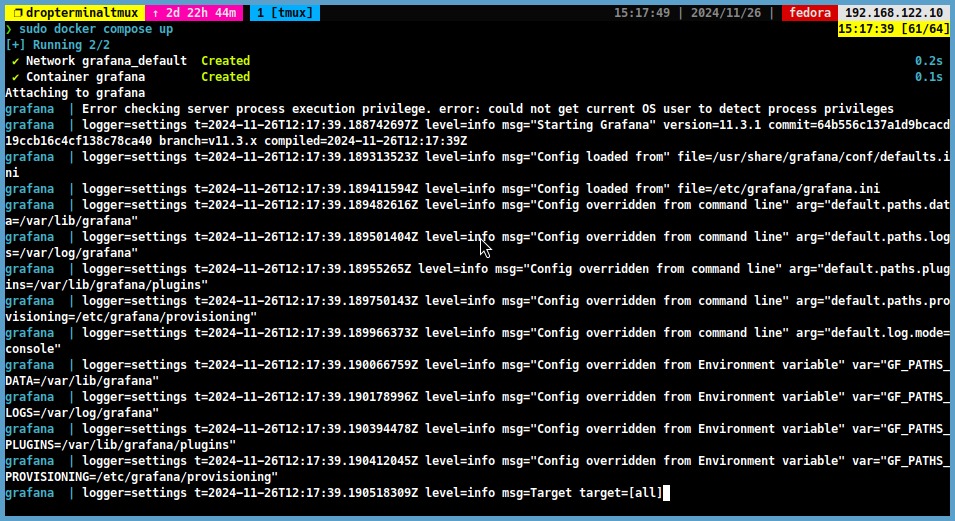
-
If all the steps are successful, you can detach from the container by pressing
Ctrl + Cand run the following command to start Grafana in the background:sudo docker compose up -d
-
Step 3: Access Grafana
- Once you have installed Grafana, you can access it by opening your web browser
and navigating to
http://<server-ip>:3000. The default user name and password areadmin. You will be asked to change the password after logging in.
Method 1: Using IP Address
-
If you are not using a reverse proxy and are using a firewall, you can access Grafana using the IP address of the server. Run the following command to allow port 3000
-
For UFW:
sudo ufw allow 3000/tcp -
For FirewallD:
sudo firewall-cmd --permanent --zone=$(firewall-cmd --get-default-zone) --add-service=grafana
sudo firewall-cmd --reload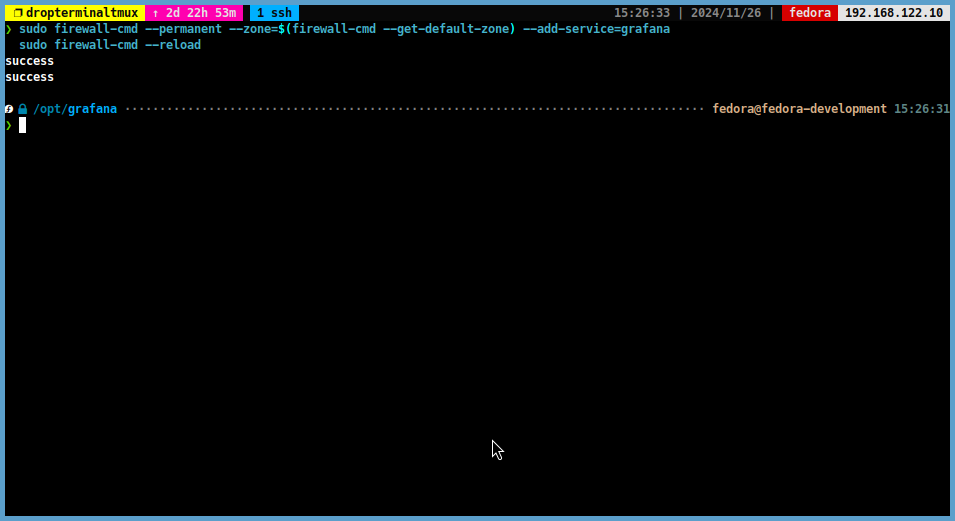
-
Method 2: Using Reverse Proxy
- To use Grafana behind a reverse proxy, you need to configure your web server to forward requests to the Grafana service. Here is a sample configuration for web servers:
Apache
-
Create a new Apache configuration file for your domain:
sudo vim /etc/apache2/sites-available/your-domain.com.conf -
Add the following configuration to the file:
<VirtualHost *:80> ServerName your-domain.com Redirect permanent / https://your-domain.com/ </VirtualHost> <VirtualHost *:443> ServerName your-domain.com SSLEngine on SSLCertificateFile /etc/letsencrypt/live/your-domain.com/fullchain.pem SSLCertificateKeyFile /etc/letsencrypt/live/your-domain.com/privkey.pem ProxyPass / http://localhost:3000/ ProxyPassReverse / http://localhost:3000/ ErrorLog ${APACHE_LOG_DIR}/error.log CustomLog ${APACHE_LOG_DIR}/access.log combined </VirtualHost> -
Save the configuration file and reload Apache:
sudo systemctl reload apache2
Caddy
Note
If you don’t have Caddy installed, you can follow this guide to install it.
-
Open the Caddyfile for editing:
sudo vim /etc/caddy/Caddyfile -
Add the following configuration to the file:
your-domain.com {
    ...
    reverse_proxy localhost:3000
}
Note
Replace
your-domain.comwith your actual domain name.
If you want to use authorization with Caddy, you can follow this guide.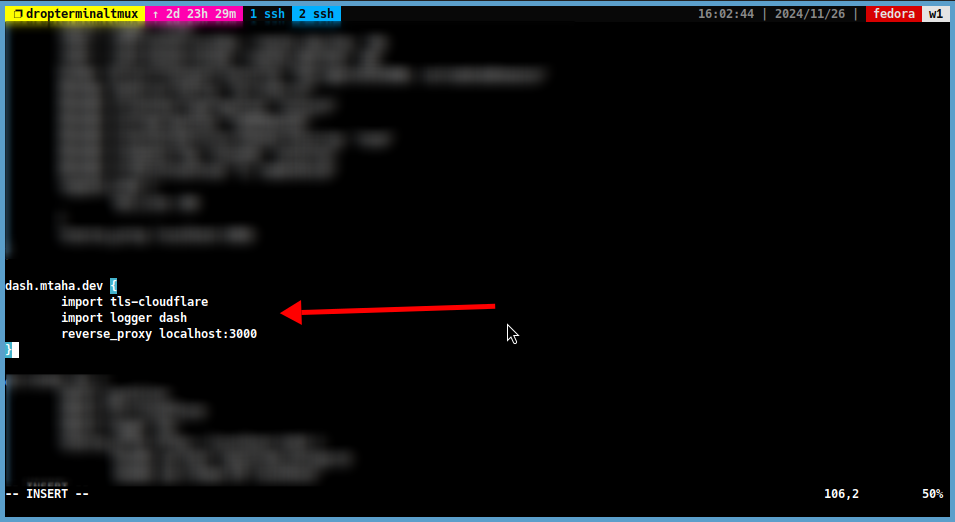
-
Save the Caddyfile and reload Caddy:
sudo systemctl reload caddy
Nginx
-
Create a new Nginx configuration file for your domain:
sudo vim /etc/nginx/sites-available/your-domain.com -
Add the following configuration to the file:
server { listen 80; listen [::]:80; server_name your-domain.com; rewrite ^ https://$host$request_uri? permanent; } server { listen 443 ssl http2; listen [::]:443 ssl http2; server_name your-domain.com; ssl_certificate /etc/letsencrypt/live/your-domain.com/fullchain.pem; ssl_certificate_key /etc/letsencrypt/live/your-domain.com/privkey.pem; ssl_protocols TLSv1.2 TLSv1.3; location / { proxy_pass http://localhost:3000; proxy_set_header Host $host; proxy_set_header X-Real-IP $remote_addr; proxy_set_header X-Forwarded-For $proxy_add_x_forwarded_for; proxy_set_header X-Forwarded-Proto $scheme; } } -
Save the configuration file and enable the site:
sudo ln -s /etc/nginx/sites-available/your-domain.com /etc/nginx/sites-enabled/
sudo systemctl reload nginx
Step 4: Add Prometheus Node Exporter to Grafana
-
After accessing Grafana, you can add Prometheus Node Exporter as a data source.
-
Click on the left sidebar and navigate to
Connection > Data Sources.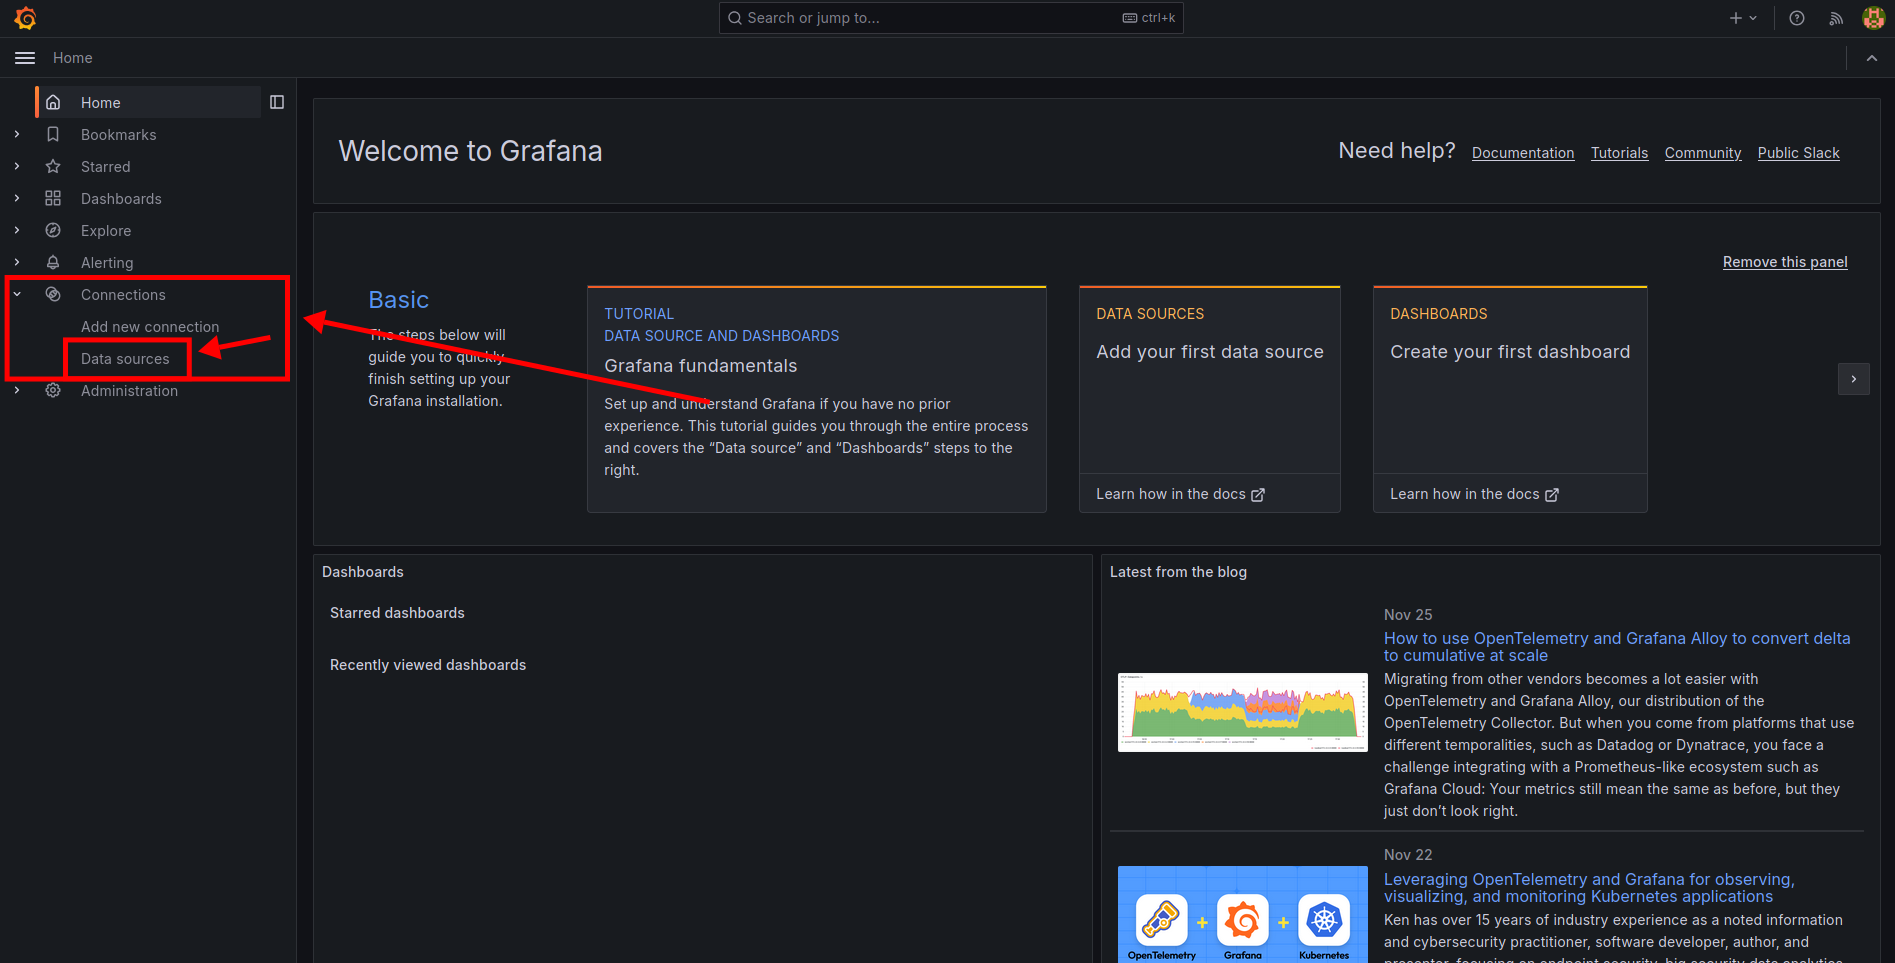
-
Then click
Add data sourceand selectPrometheusfrom the list.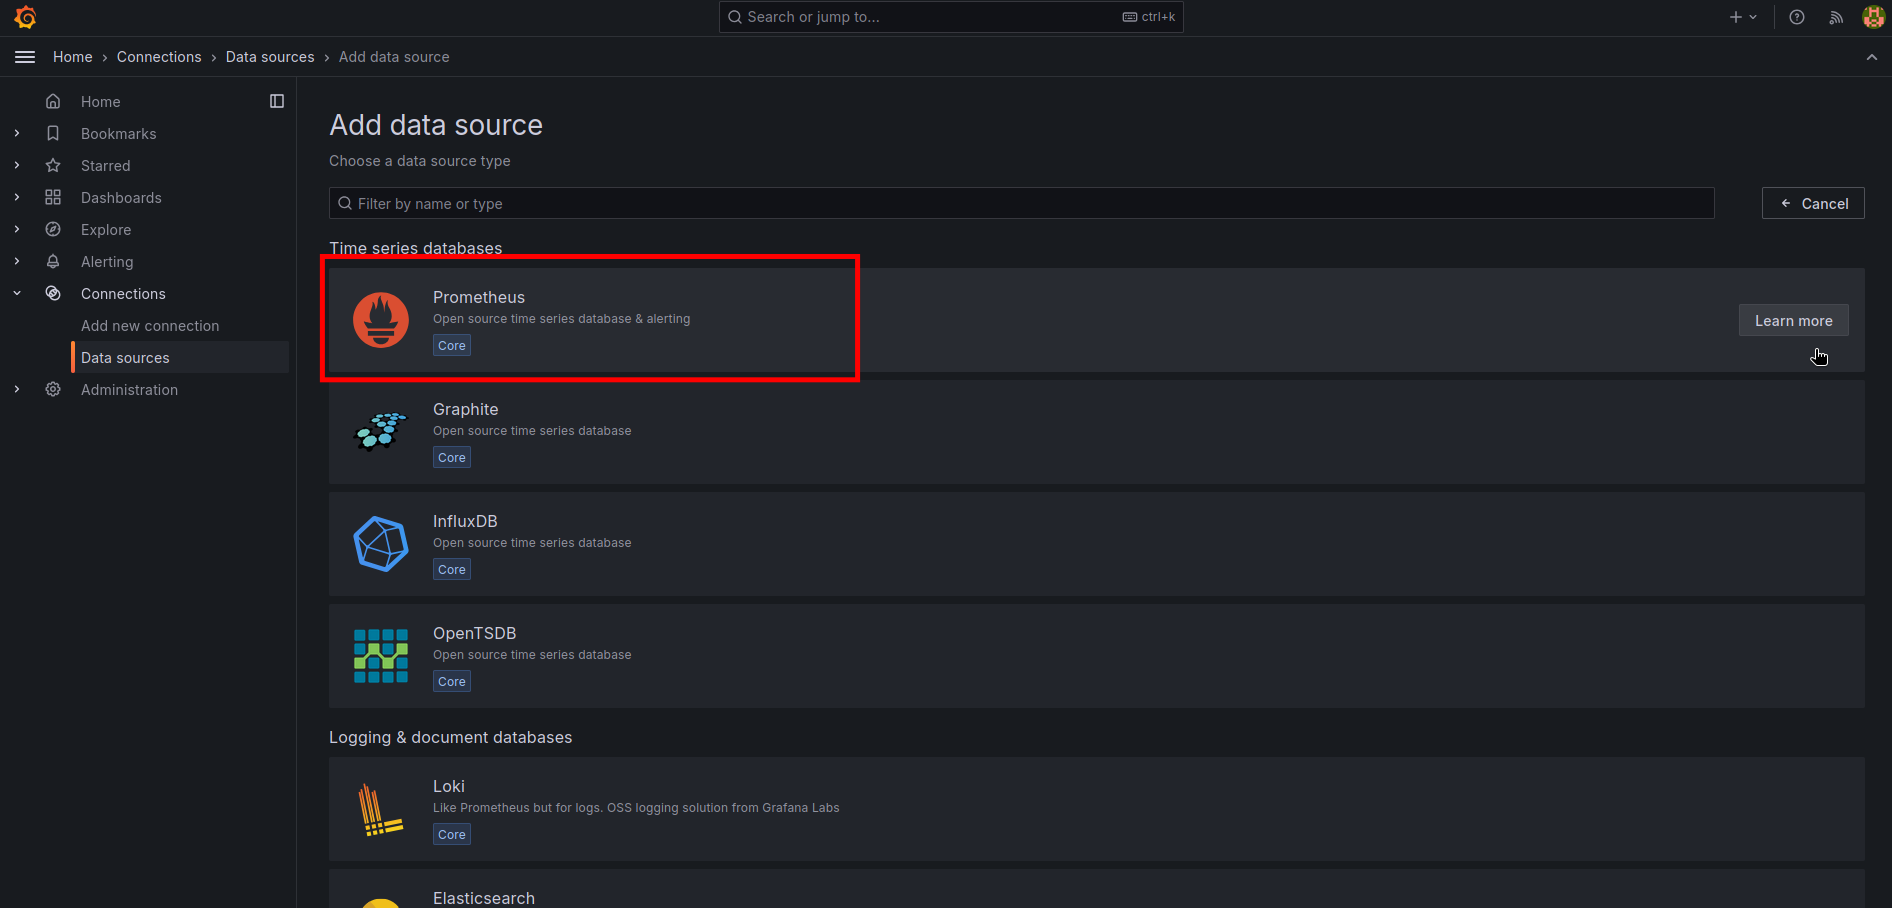
-
In the
Connectionsection, enter the URL of the Prometheus Node Exporter. The default URL ishttp://localhost:9090.Note
If you are using the docker method, you can use
http://<MACHINE-IP>:9090as the URL.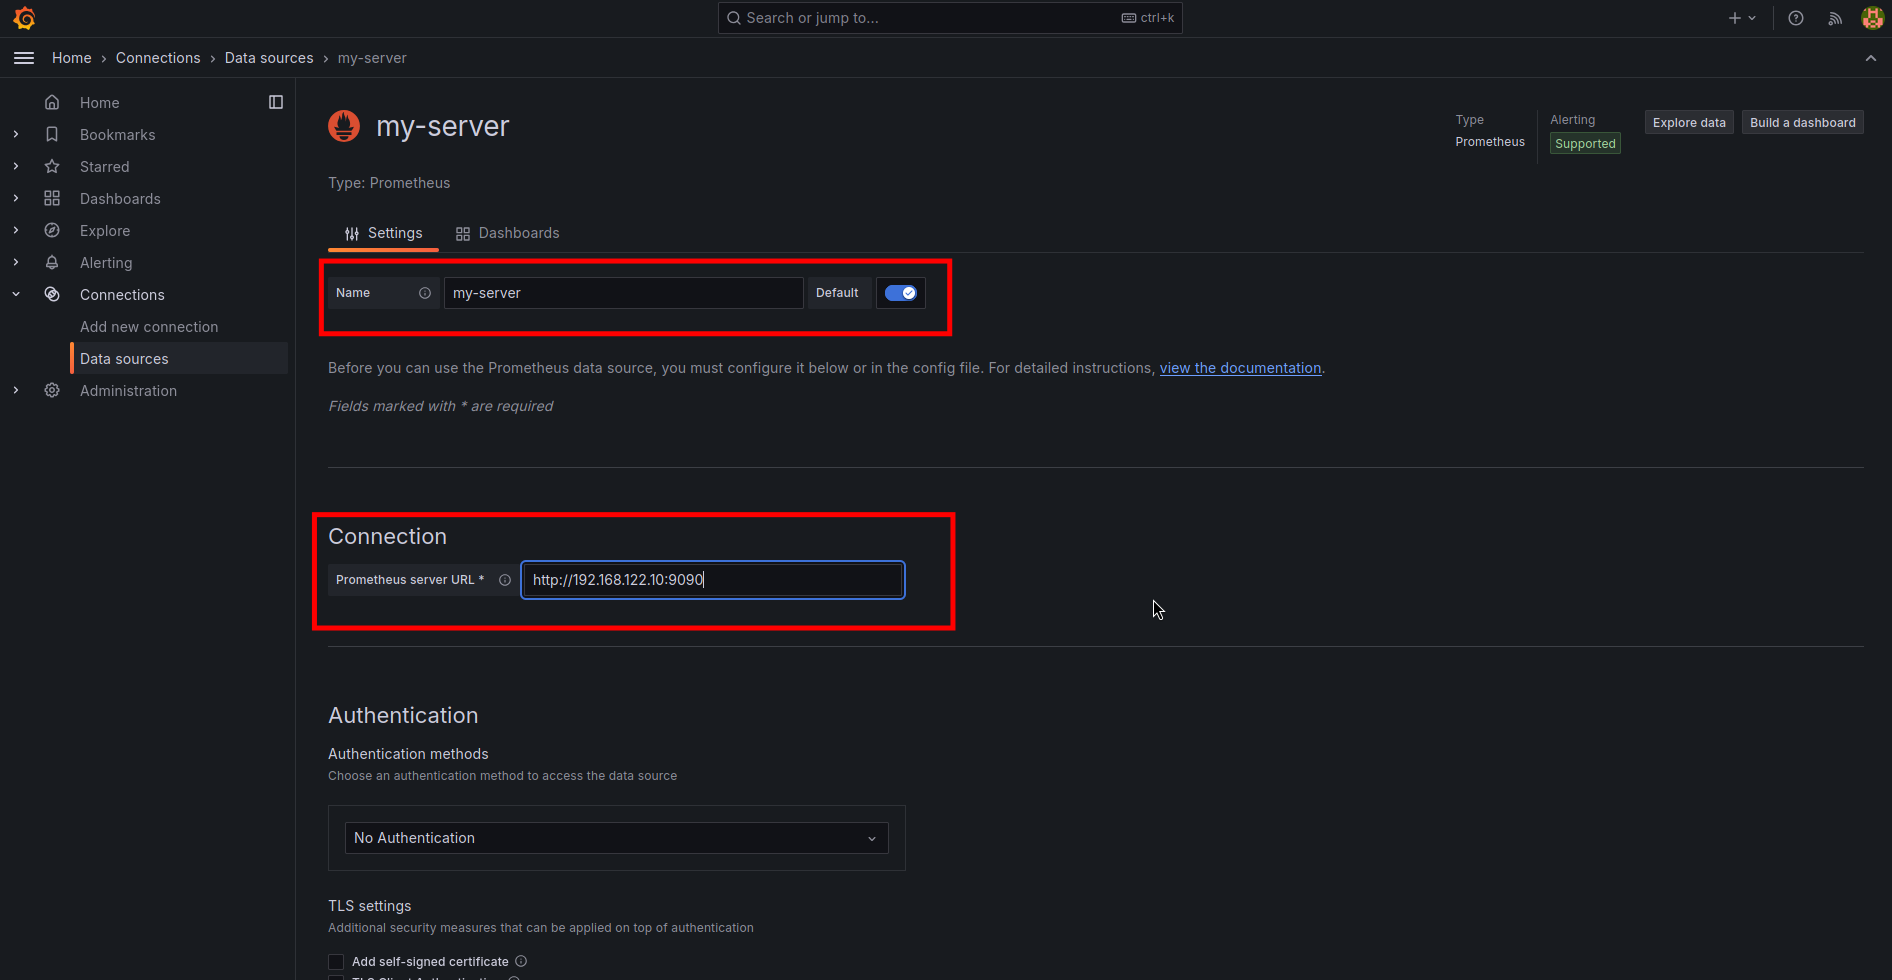
-
Then click
Save & Testto save the data source.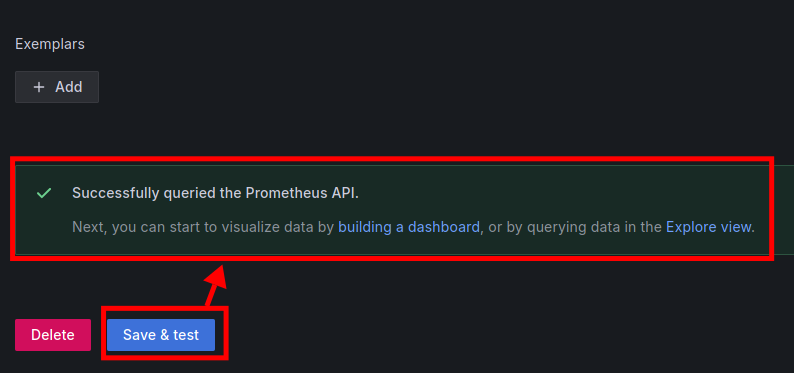
-
After adding the data source, back to the
Dashboardand click onCreate Dashboard.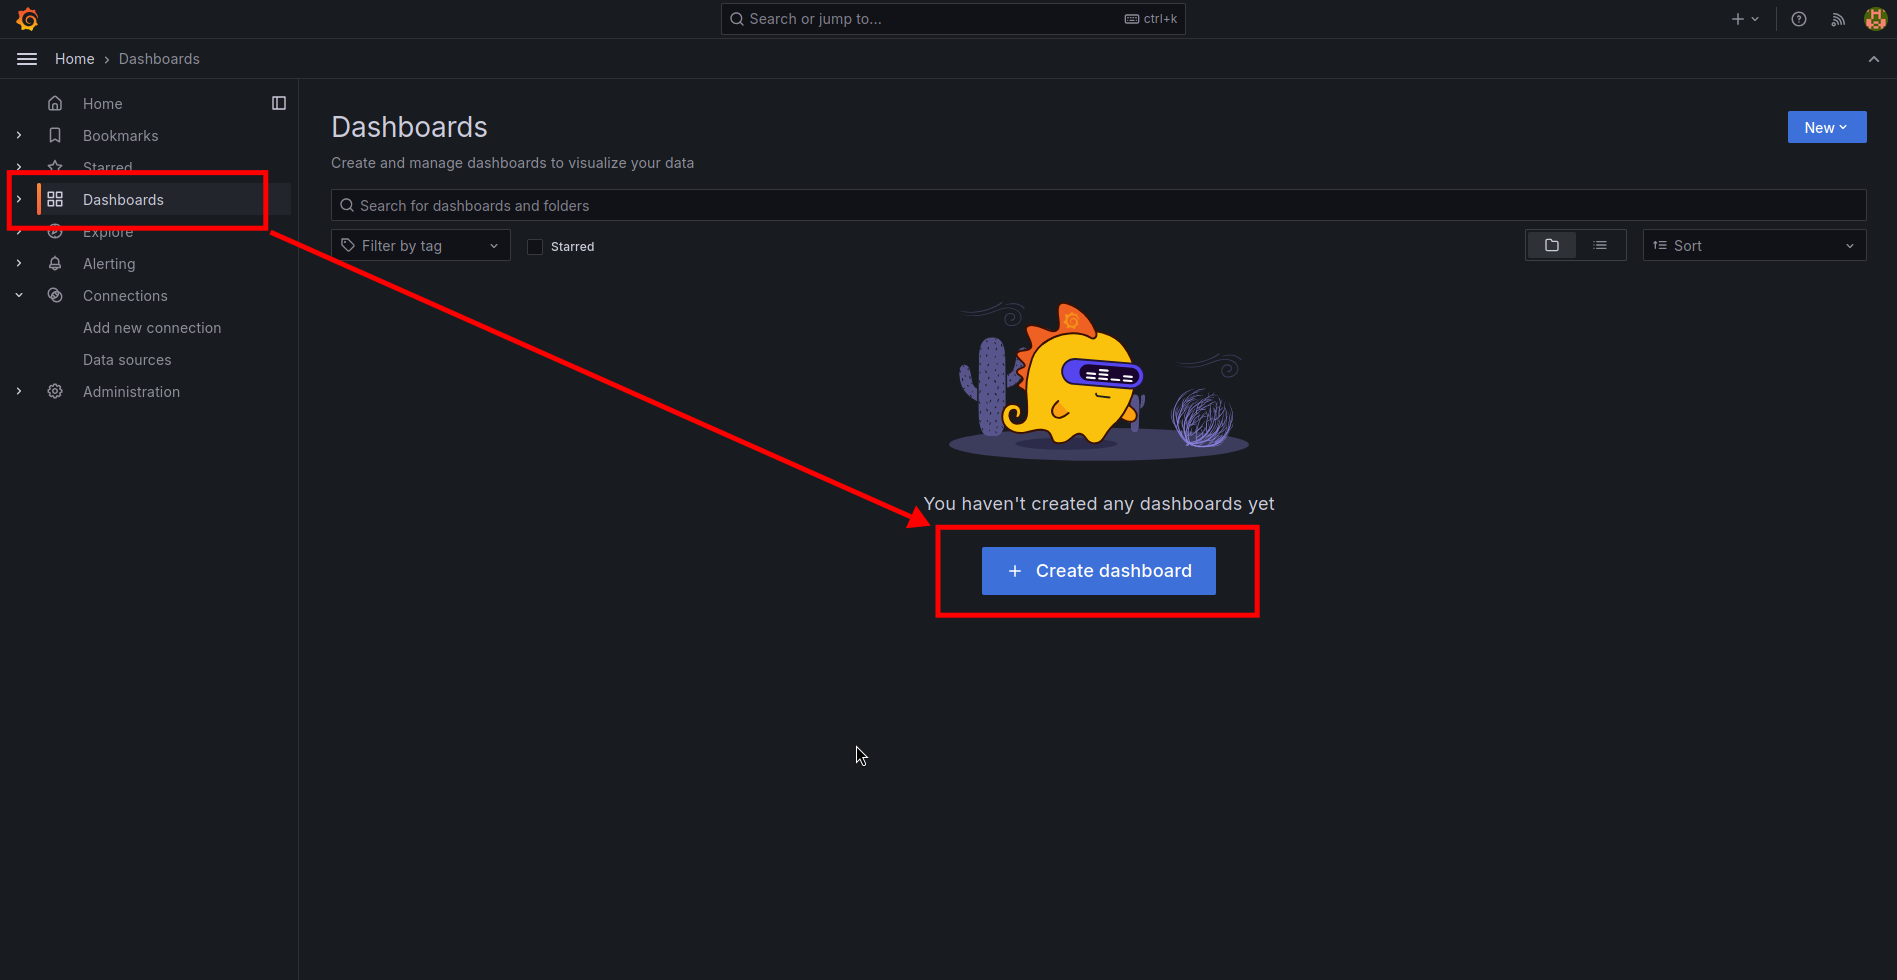
-
Then click
Importand enter1860in theGrafana.com Dashboardfield.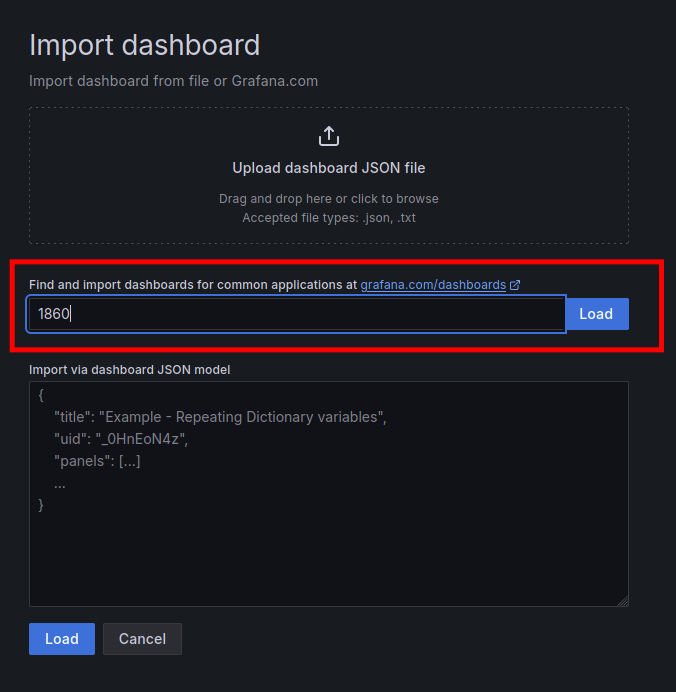
-
Then click
Loadand select the Prometheus data source from the list.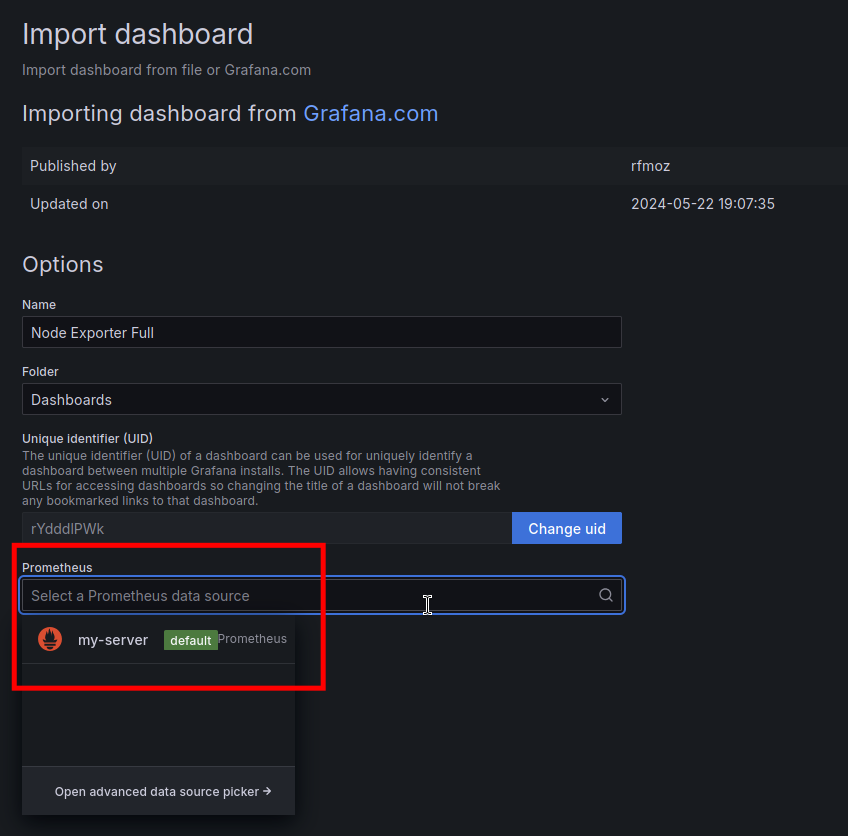
-
Then click
Importto import the dashboard. You can now see the metrics of Prometheus Node Exporter in Grafana.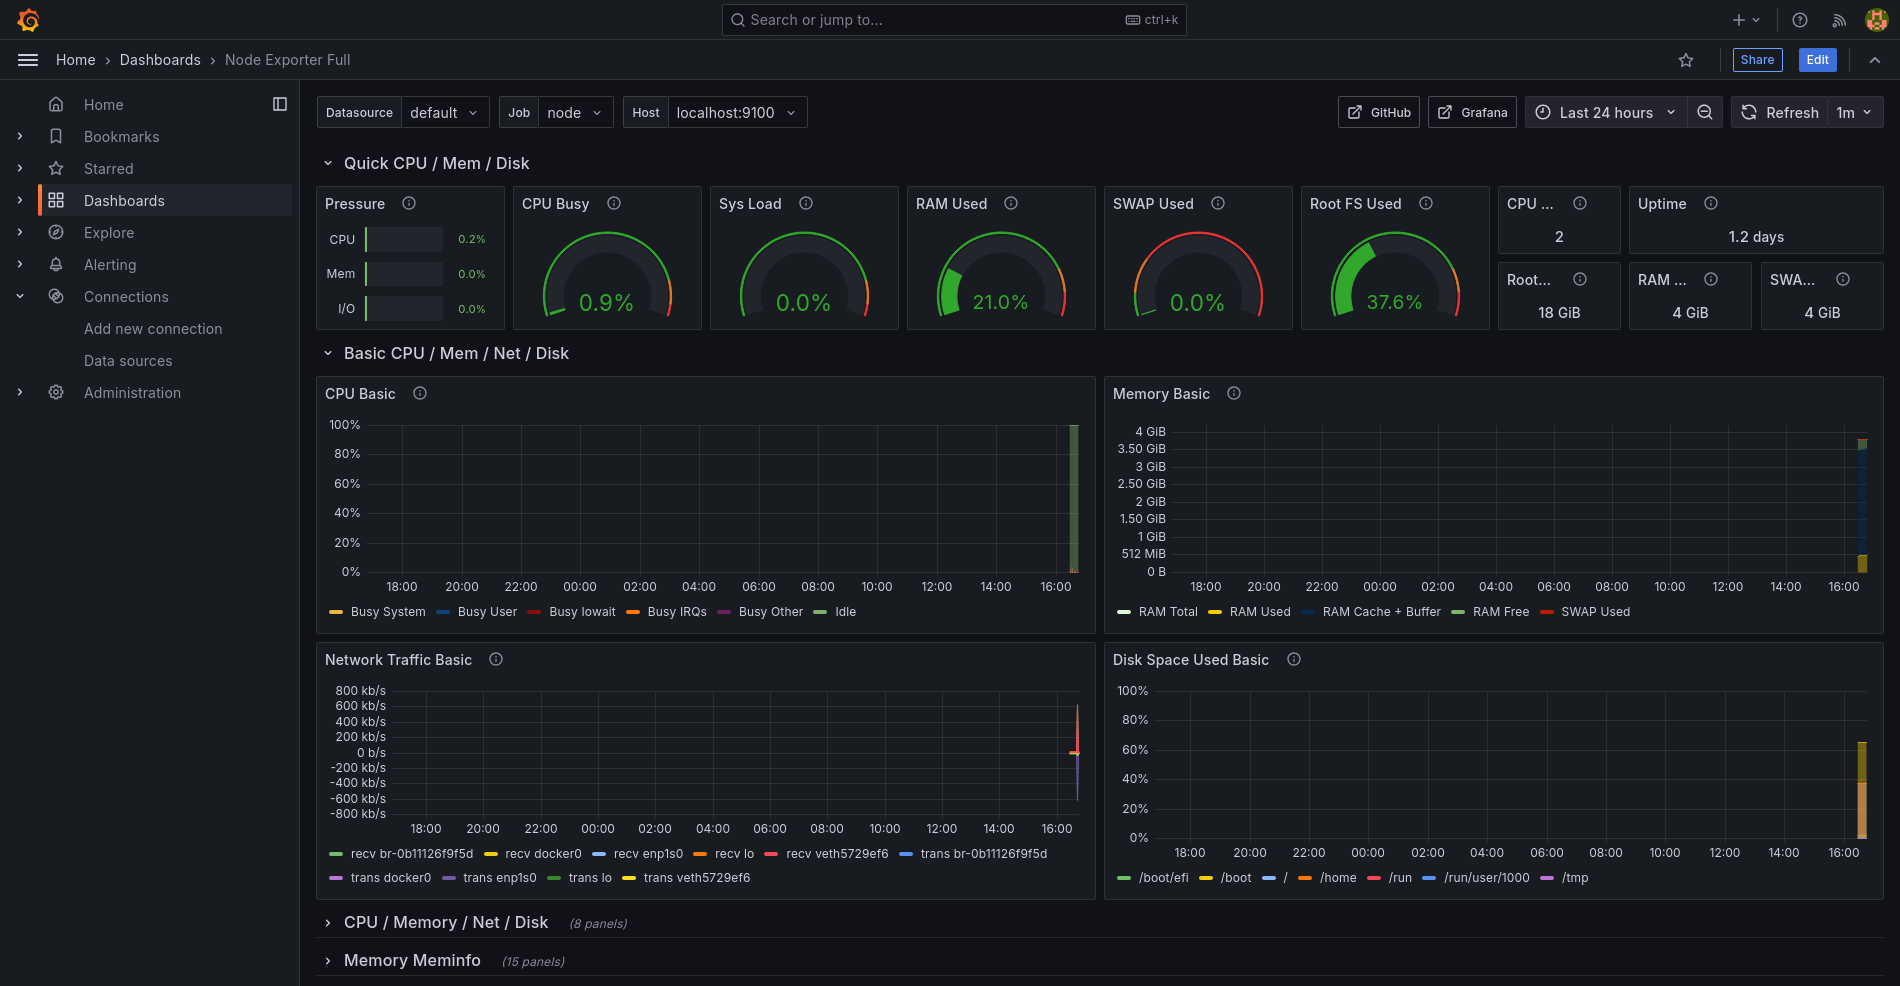
-
You can customize the dashboard by adding more panels and changing the settings.
Conclusion
- By using Grafana and the Prometheus Node Exporter, you can monitor your system performance in real time, identify potential problems early and make data-driven decisions. This powerful duo makes it easier than ever to improve operational efficiency. In addition, customisable dashboards allow you to visualise your systems according to your specific needs.